Sunday, September 18 2016
The S&P 500 (and its Index ETF, the SPY) have recently formed a very bearish trading pattern, the so-called " Descending Triangle" (sometimes referred to as a "Descending Pennant"). Many times, the market drops through the bottom of this pattern, and heads down from there. See the graph immediately below.
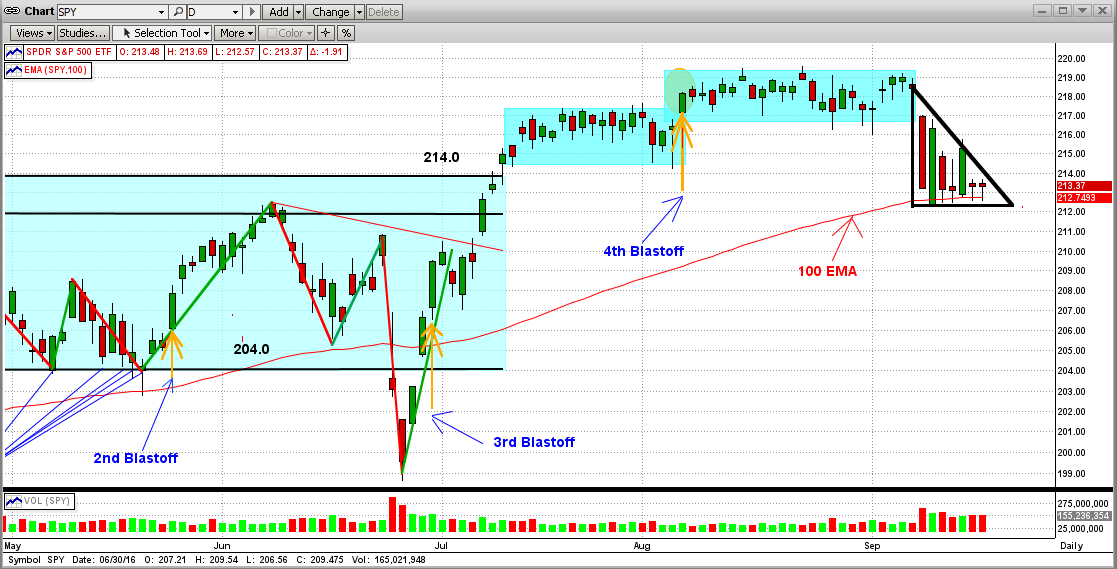
But these are not normal times, like when the market reacts to good news with gains and to bad news with losses. This is a market dominated by a small, but powerful, agency called the Federal Reserve. Of course, most of you know that; and are just as sick and tired of the Fed Chairperson, Janet Yellen, as I am and millions of other investors are. She has lost respect from just about everyone that invests in stocks and bonds, except from the fat kats that benefit greatly from extremely low interest rates. They make $ billions on the money that we (the American people) lend them at ridiculously low rates.
--------------------------------------------------------------------------------------------------------------------------------
For what I think is a good analysis of today's short-term market, read the blog below.
Borrowed from Jack Steiman www.SwingTradeOnline.com
Friday September 16th 2016
The week was wild, but quiet when all was said and done. Last Friday (9/09/16) saw a strong move lower with no follow-through to the down side this week by the bears. Nothing unusual about that. The bears haven't followed through meaningfully in longer than I can remember. That said, this week saw the market move mostly lateral, meaning the bulls didn't just blast things right back up as they usually do with no resistance from the bears. The bears are fighting a little bit. More than we've seen in recent months. The volatility is higher, due to the behavior in the VIX from last week’s down side action. It's not as boring now as it was months prior. At least we're not trading day after day in a very tiny range of one percent or less. Two months of that was enough thankfully. I think folks like the volatility but let's be honest, going nowhere doesn't make trading much easier. One could say a bear flag is forming short-term, but that's irrelevant for one major reason. Fed Yellen.
Here she comes again with yet another “no-rate-hike” statement for our listening pleasure come next Wednesday. The action all of this week was due mostly to the market waiting to hear what fed Yellen will do to the fed market. Nothing matters any longer. Only the fed matters, and that's really sad-but-true statement about our current market. The market is sitting mostly flat as it awaits the good tidings from the mouth of our market leader. Nothing much will happen until she talks, and lets us all know what the future holds in terms of rates. The market on-hold is so boring, but so common now. So, yes, it's all about next Wednesday, so place your Russian roulette bets.
I think I know what Fed Yellen will say Wednesday. I think the market knows what she will say on Wednesday. The market is not expecting a rate hike. It's not going to happen for three simple reasons. ISM Manufacturing Report, ISM Services, and Retail Sales. All three reports were a disaster. Big misses the last week plus, and those misses were all on the most important aspects of our current economy. Everything is slowing, and doing so quite dramatically. We all know how she hates to raise rates when things are going well, so the odds of her raising rates, in my opinion, are zero. I could always be wrong, but that's my thinking.
In Yellen’s mind, a declining economy must be in concert with near zero interest rates. My guess is, she will also mention, once again, about how she will be watching future data on the economy, meaning she's not raising rates this year in all likelihood. She will need to see many consecutive months of improvement in all the key areas, and right now we're going the wrong way. The real question is what the market will do when she says no rate hike and talks about being data dependent. Will the market finally say it doesn't care and start moving towards truth, or will it stay in Disneyland? We'll find out soon enough. History says the market will blast up on the news. I'm not so sure this time, but we'll know on Wednesday.
You really have to wonder how a market can hang in there with news on the economy being so bad. I think the real concern in many ways is away from the economy. The real world says folks are struggling and doing so in a big way. Manufacturing is in a technical recession, based on it being below 50.0. A 49-reading a week is back. Services, which is most of our economy these days, went from 58 down to 51. A scary drop in such a small amount of time. Retail sales went away. The precipitous drop out of the blue has to be very concerning for our economy without any concerns for our few market. What is really going on? Rates have been low forever. There have been endless QE programs. Part of Europe, and all of Japan, is dealing with negative rates, yet nothing is coming alive economically on global level. Nothing seems to be working, so you have to wonder what the fed is thinking. None of her tricks are working. Central bankers around the world just can't get anything to work.
The real concern is to take care of the public, and that seems to be something that's not happening and many are suffering. I have no answers nor does the fed, it seems. That said, we'll see what Wednesday brings and how the market reacts.
Keeping it light here.
Peace,
Jack
Saturday, September 10 2016
Friday was a terrible day for investors worldwide. And yes, it was the Fed again. How the Fed's actions can overshadow market fundamentals (low earnings, over-valued stock prices, faltering economies throughout the world, etc.) is beyond belief. But then again, an extremely low, or negative, interest rate policy is a major incentive.
Friday's drop seems to many as a disaster [see the graph for the S&P 500 ETF (SPY) below]. And, from the big drop in this daily graph (orange ellipse), it sure seems that way. Seems as though the world is coming to an end. When just a suggestion from one Fed official (not even Yellen) can move the market to that extent, this means to me that large investors and traders are sitting with their fingers on the sell button. Remember, these guys can push a market way down and then way back up like nothing happened.
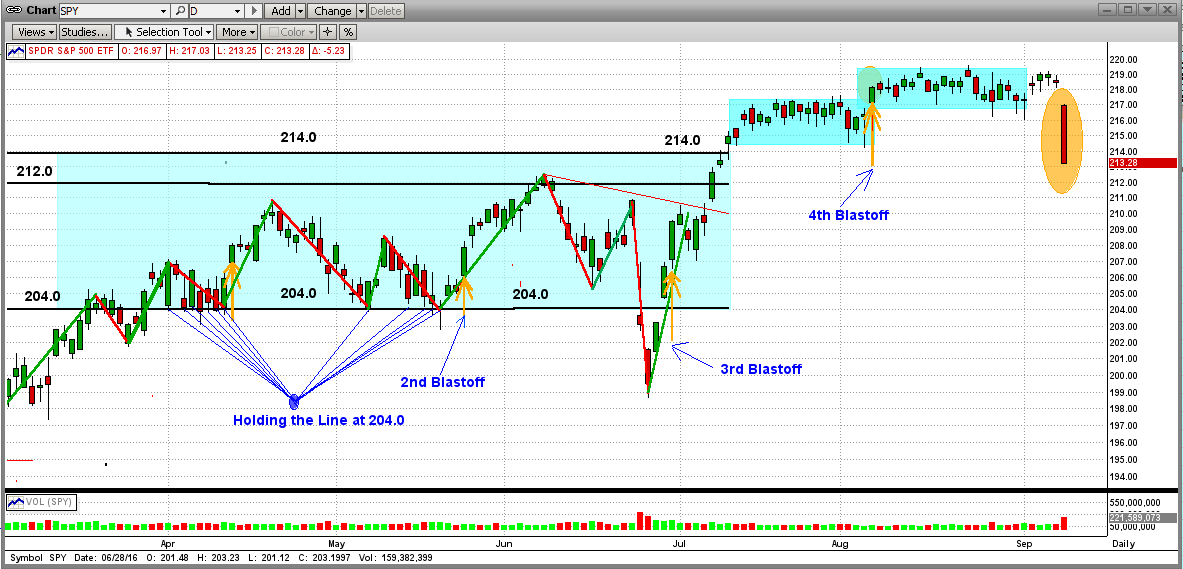
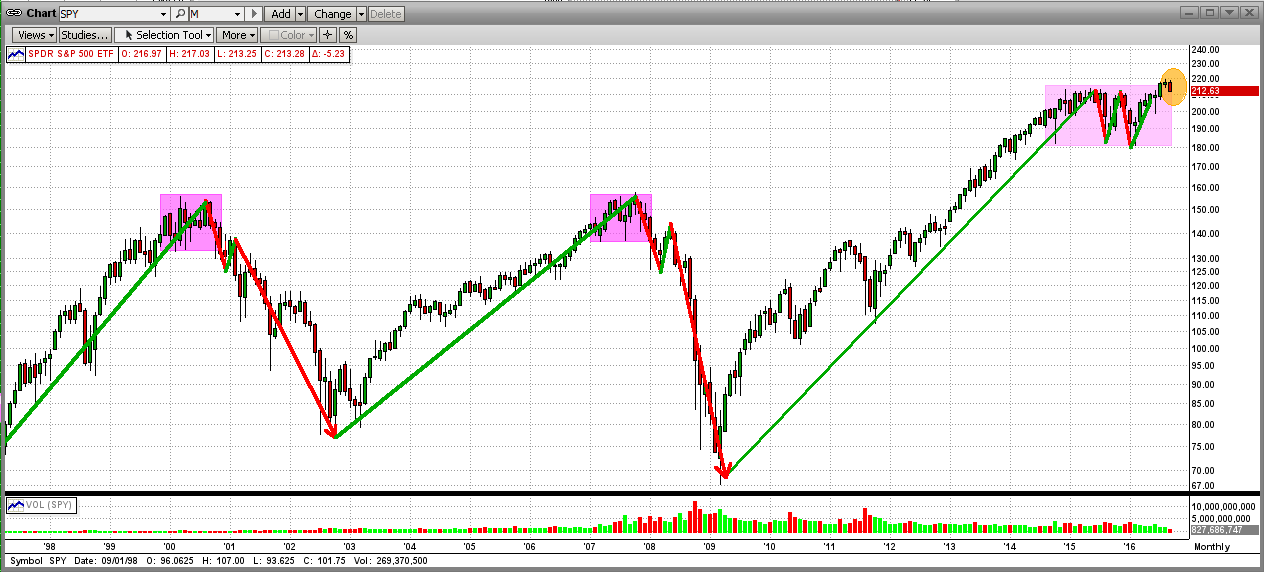
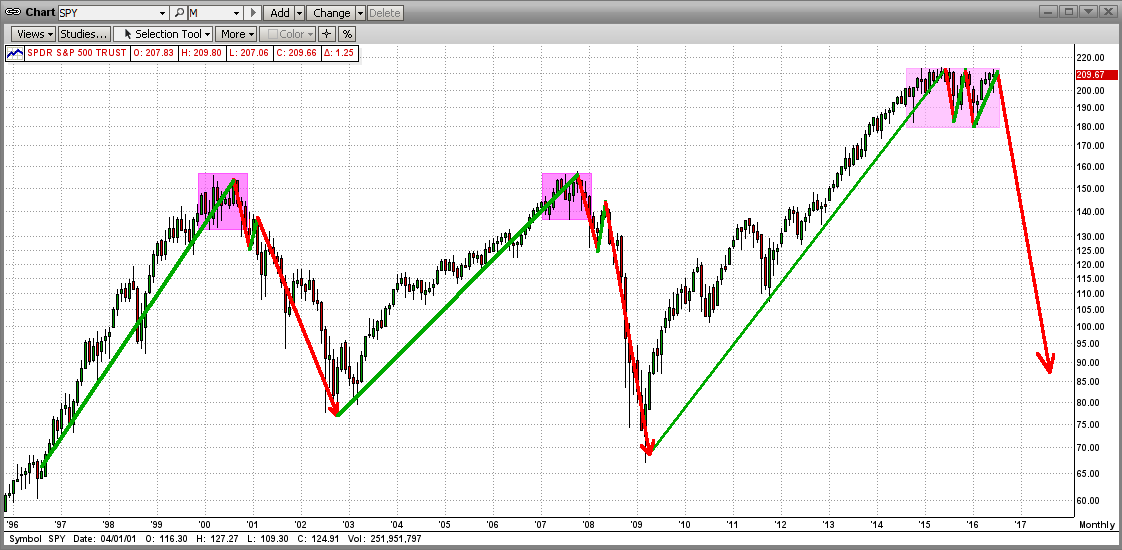
So, just how bad was Friday's drop and how likely is it to continue? For a clue, examine the monthly graph immediately below. Look at (or even look "for") Friday's disaster. What looked like a disaster on the daily graph looks like a "blip" on the monthly graph (orange ellipse). This kind of "puts things in perspective". The point is that, even though Friday was a very bad day, there is no strong indication that the drop will continue (even though the up-trend has been damaged). And, our MIPS models DID NOT ascertain a trend change from Friday's action.
Things can change on a dime, so
Stay Tuned...
|
Monday, August 01 2016
There is a lot of excitement in the stock market because of recent new highs, the Fed's soft approach to interest rate hikes, European and Japanese new financial incentives, etc. Are we "jumping the gun"?
DAILY VIEW
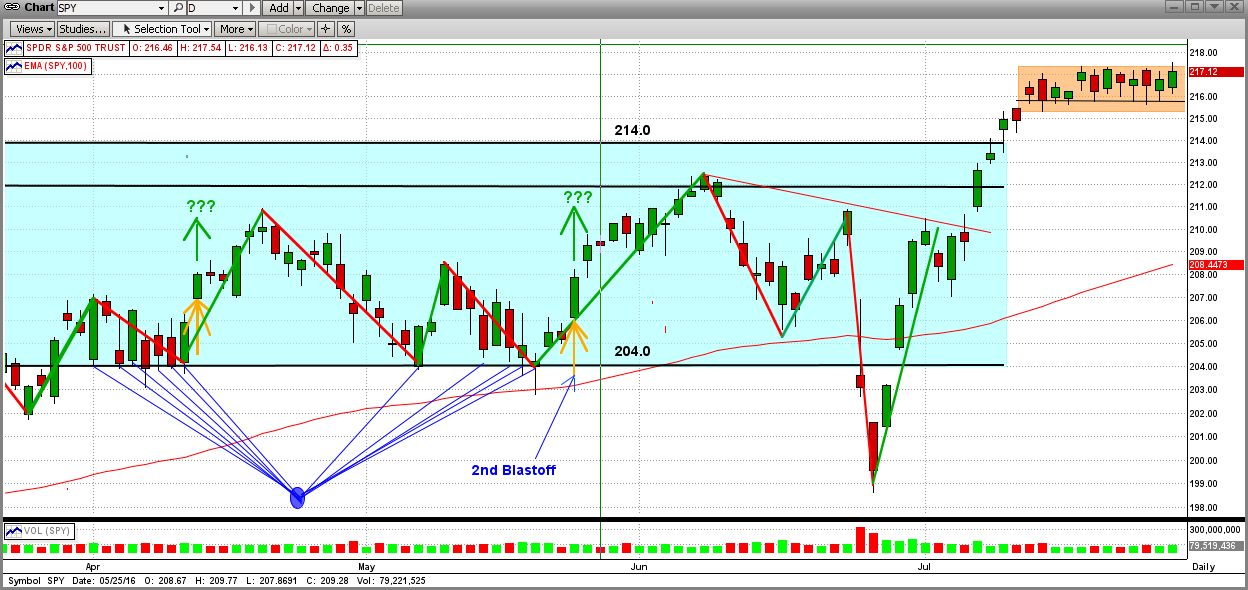
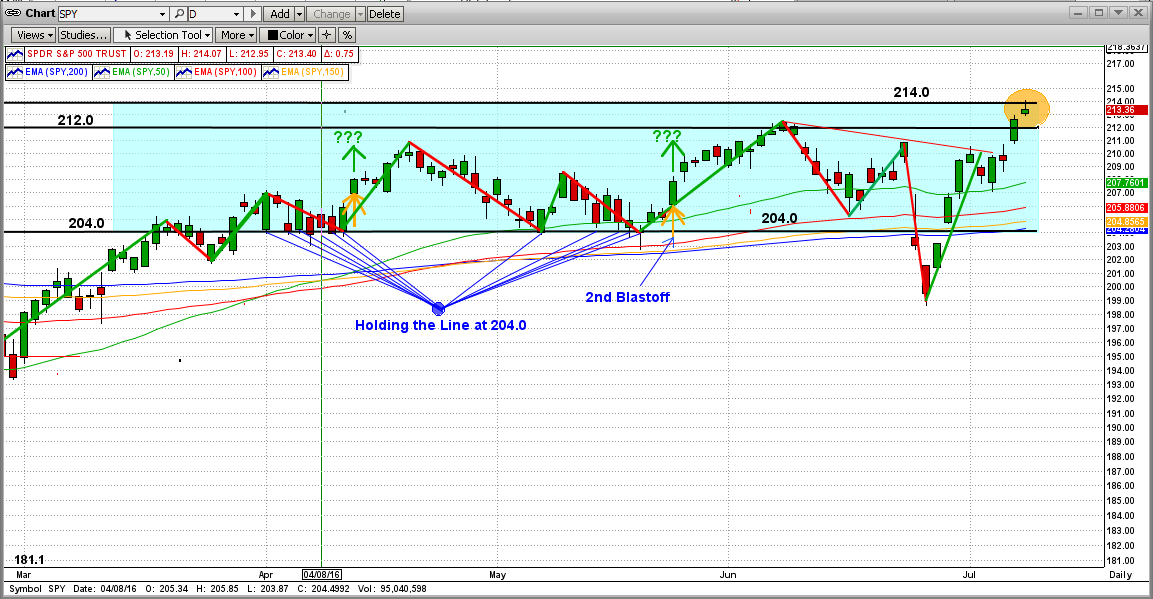
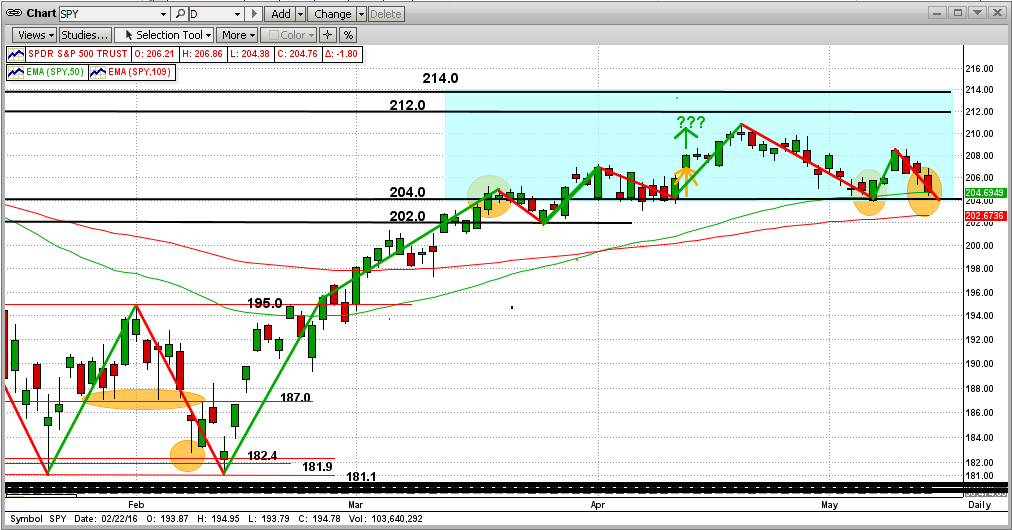
In the graph below you can see that the downside support of the SPY at 204.0 was rock solid and it "fended off" ten attempts from the Bears to drive the market lower. But, after a short bounce up, the market got hit big by the "Brexit" vote in the UK on 6/24/2016, and that drove the SPY down about 6% in just two days!
After a short V-Bottom, the SPY rocketed back up, and on 7/12/2016 it passed its all-time high of 213.5 (2135 on the S&P 500). Usually this would mean strong sailing ahead, at least for a few months. But no... without much time for celebration (two trading days later), the SPY went back into one of its beloved "extremely-tight, sideways trading patterns" at less than 2% above its previous all-time high. This is not good, but most probably temporary.
Monthly VIEW
Another way to look at this is from a distance. See the monthly chart below. There has been a lot of hoopla about the new all-time highs in the market in the last two weeks, but from another view we can see that it is way too early to celebrate. From a monthly viewpoint, the "new highs" (orange circle on the top right) are barely noticeable. Of course, a new bull run has to begin somewhere, but let's not throw caution to the wind just yet.
In spite on my "caution" tone above, the MIPS models are all Long, but let's proceed with care. The market looks like it is headed up from here, but let's follow what MIPS tells us what to do.
Stay tuned ...
Monday, July 11 2016
The market (S&P 500 and SPY) has been moving up nicely for the last two weeks. The objectives are, of course, for the market: (a) to move out of its exhausting 15-month sideways trading pattern, (b) to break above its all-time highs, and (c) to follow with a strong upward move. The all-time "closing high" for the S&P 500 is 2135 (approx, 213.5 for the SPY), and its all-time "intraday high" is 2140 (approx. 214.0 for the SPY). The SPY has come close to or hit 214.0 about 10 times in the last 15 months, and has failed to break above it each and every time (fierce Bear counter attacks).
Today's market action did nothing to make investors feel confident that this is the time that the SPY will see both closing and intraday highs. The SPY did hit and trade slightly above 214.0 intraday today; but when it penetrated the Bears "front line" at 214.0, the Bulls got forced back to close below both the SPY's closing and intraday highs (orange circle in the graph below). Also, the SPY is still in the notorious 15-month sideways trading pattern.
The Bears "held the line" today. Not a good sign, but this is almost certainly NOT the Bulls' last try at breaking above the all-time highs and heading for the sky. If the Bulls do succeed, it will not be without a fight from the Bears. No definitive winner yet !!!
This is not a time to be too aggressive, because the near-term outcome is not easily predictable.
Sit tight and wait for MIPS to tell you what to do...
Sunday, July 10 2016
As Q2’16 came to a close, this blog turned out to be completely different from what I had planned a week before. Of course, this quarter’s D-Day for stock markets all over the world was the vote by the Brits to leave the EU (the so-called BREXIT). With the Brits voting to leave, the worldwide performances for the quarter were severely damaged in one day. Compared to this, all other topics are boring. Since the BREXIT vote, the markets have rebounded some, but not with enough time to recover the entire BREXIT losses before the end of the 2nd quarter.
My fear is that the rebound is only temporary, simply because the “Market to Nowhere” (in the case the S&P 500) is approaching its VERY STRONG resistance level at its all-time closing high of 2135 (and its Intraday high of 2140) again. This is something that the market has tried to break, and failed to do, over ten times over the last 17 months.
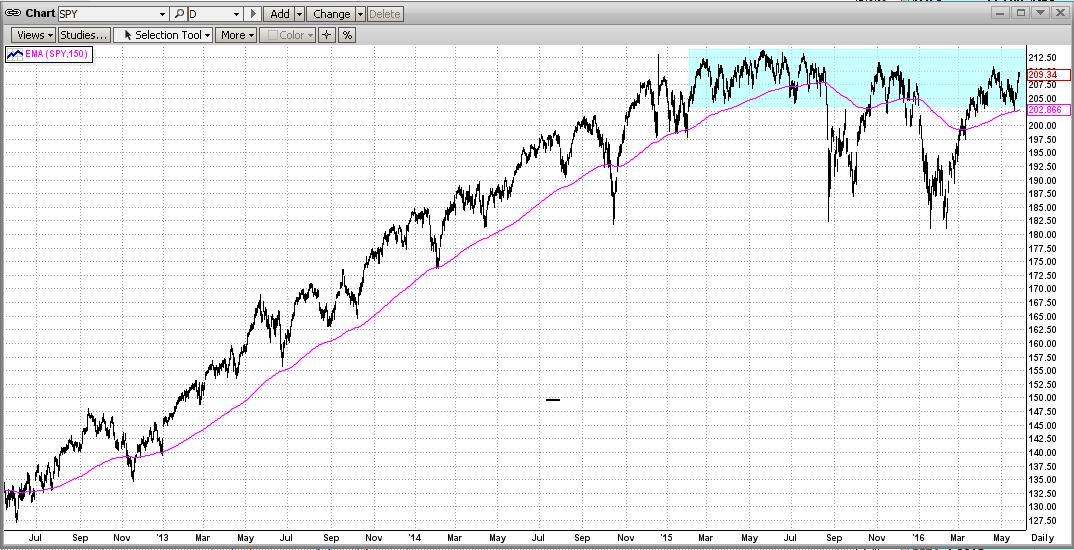
This record flat tight-trading range should be the main topic of Q2’16 as it has been for over the last 18 months. There are some very serious reasons for this strange, rare market behavior. Take a few seconds to look at the graph below and concentrate on the blue rectangle on the top right. This blue consolidation pattern represents a FLAT trading range of roughly plus and minus of 2.4% for nearly one and one-half years, with two big drops in between. That is phenomenal and very rare. Remember, this means that when the market is in a tight pattern like this, and you do not trade at all during the entire period, it would not matter much if you stayed long, short, or in cash. On the other hand, if an investor tried to trade this market, they could have ended up getting whipsawed mercilessly.
“Big Picture” Outlook
In the graph above, you can see that the two big moves to the downside, below the trend line and/or through the bottom of the blue trading pattern, were fast and deadly (that is, volatile and deep); whereas the moves to the upside got slapped back every time the market approached its all-time high. This says to me that most large investors may be expecting a big drop, and have little or no confidence in the market making new all-time highs.
Yellen’s Up Market
But, please do not underestimate the immense power that the “Master Market Manipulator” (Federal Yellen) has over the stock markets. If Yellen wants the market to go up (or at least to not go down), she will simply repeat what she has concocted to make her “black magic” successful over the last 7 years. This time, however, if the market does break to the upside, the sky is most likely the limit !!!
Extremely Strong Resistance
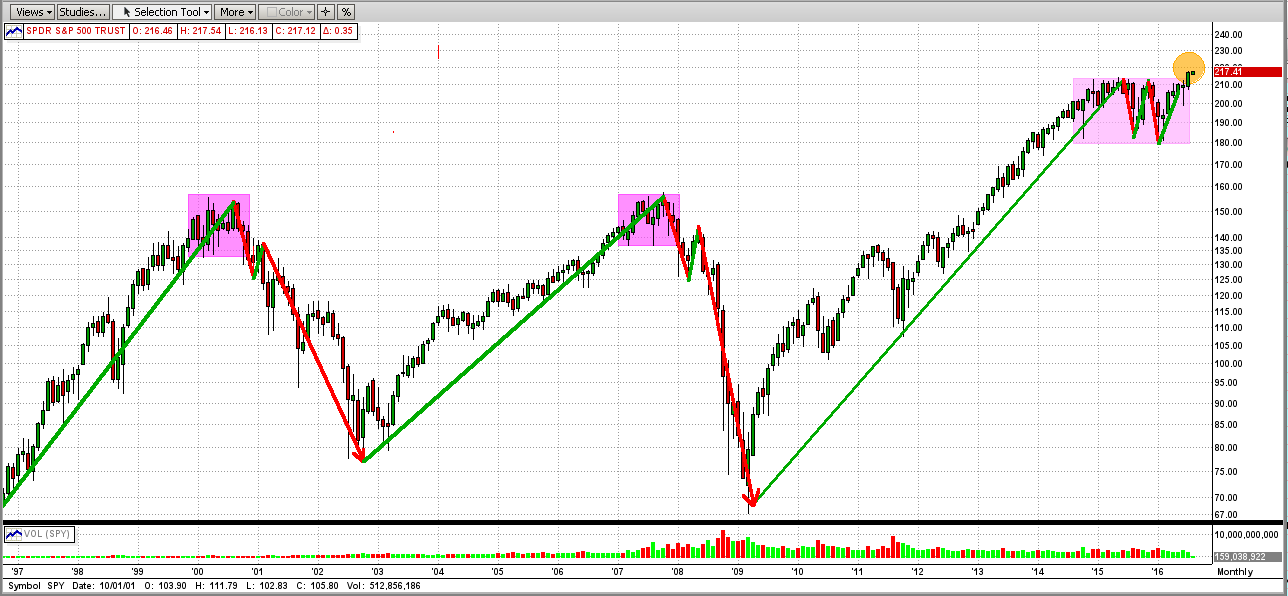
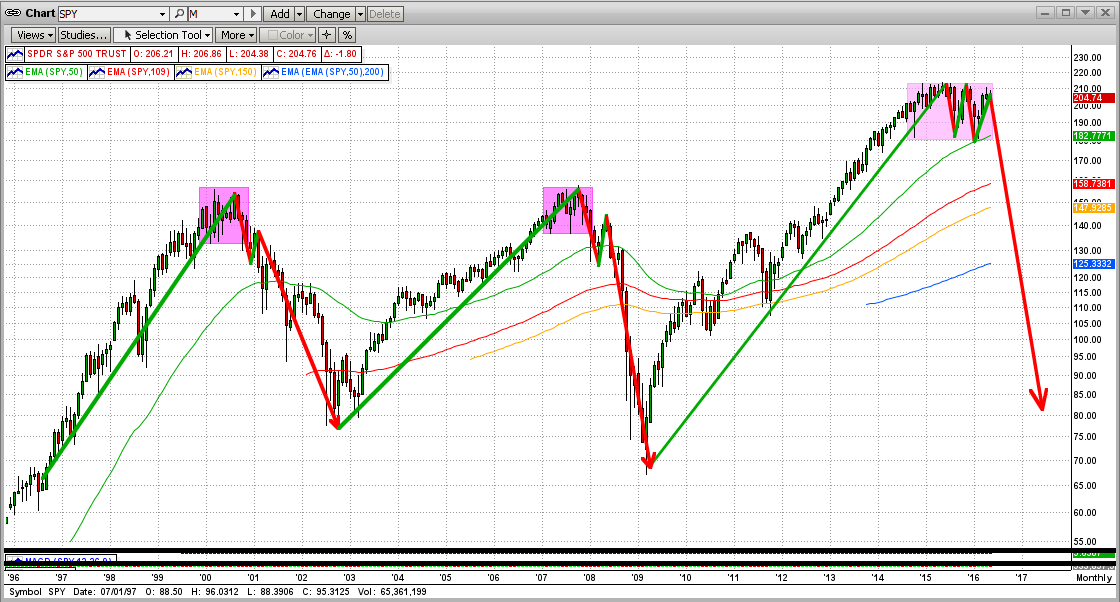
On the other hand, even with Yellen’s help, breaking the all-time high of 2140 on the S&P 500 will be like breaking through a 10-foot-wide steel wall. The Bears are lined up there with all of their guns loaded (sell orders) and are ready to fire when they can “see the whites of their eyes”. The end result of this could be another “topping pattern” as in 2000 and 2008 (see graph below).
In 2000 and 2008, the markets waffled (“topped”) in a tight consolidation pattern for 10-12 months before breaking to the downside and crashing 40-50%. In 2016, the market has been “topping” in a very similar trading range for almost 22 months, and could be getting ready to dive.
Be careful !!!
Preservation of Capital Rules...
MIPS Models
After the big one-day “hit” from the BREXIT on 6/24/2016, the performance of our MIPS4 model:
a) trading 1.0x SPY Long and 1.0x SPY Short, and
b) trading 1.5x SPY Long and 1.0x SPY Short, and
were near breakeven for 2Q’16, but they remained up about +1.5 and +3.0% YTD in 2016, respectively.
Sunday, July 03 2016
We have acquired a lot of new MIPS members over the last 6 months, some of whom are not sure when to trade a new MIPS signal, especially over a weekend or holiday.
If you just remember this, you cannot go wrong...
- upon receipt of each new MIPS Signal Change email, you trade on the next available market opportunity.
For example:
- if you get a Signal Change email on Friday night, you trade the new Signal on Monday's open, or
- if you get a Signal Change email on Sunday night, you trade the new Signal on Monday's open, or
- if you get a Signal change email on Monday morning before the market opens, you trade on that open.
In all of the above cases, you would be trading the new MIPS Signal (if any) as of Firday's close.
For more, you can click the "Services" tab in the main menu and then click the blue button on the upper left entitled "How/When to Trade"; or simply click here => http://www.mipstiming.com/how_when_to_trade
Tuesday, June 07 2016
In the last few months, the Bulls have pushed the SPY up all the way from 181. If the SPY breaks through 214.0 soon with force, the sky is the limit.
But, there is tremendous resistance at SPY 214. The Bears will fight a move above 214 with vigor. If the Bears win this Battle of 214 (i.e., the Bulls fail to "carry through"), we could see the SPY drop back to 204 or all the way back to 181.1 or more.
My guess is that we will see all-time highs in the S&P 500 and then the market will take a significant drop. But, what do I know? Again, we should rely on MIPS to tell us what to do. Stay tuned...
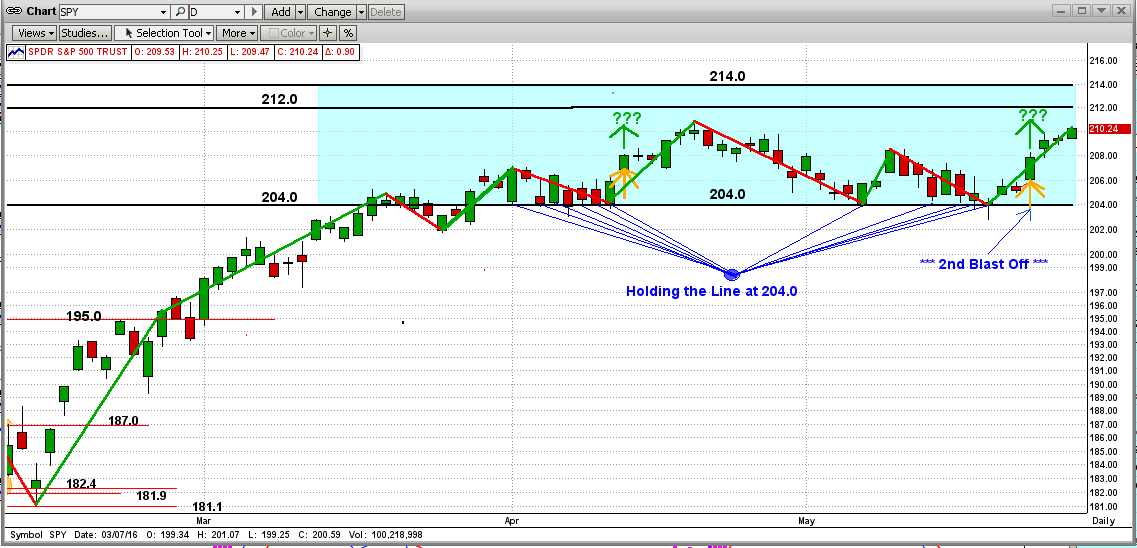
Monday, May 30 2016
After holding again at its very strong 204.0 support level, the SPY "Blasted-Off" again last Tuesday (5/24/16), heading for its all-time closing high at 213.5 (the intraday high is 214.0). If the market breaks above 214.0 (approx. 2140 on the S&P 500 Index), with some degree of strength, we could easily get a 5-10% rally thereafter.
Two things stand in the way of this:
- one is the Fed (surprise, surprise) and
- the other is the SPY's extremely strong resistance at 214.0. This is a very tough one to call, but we have high confidence that MIPS will pick up the trend quickly.
Stay tuned...
Thursday, May 19 2016
The Fed's big mouth Yellin is yelling and the market is running for the hills. On economic news that should have been good for the market, the Fed once again managed to make it bad news by insinuating the re-start of rate hikes and possibly even more quantitative easing (which would become QE4).
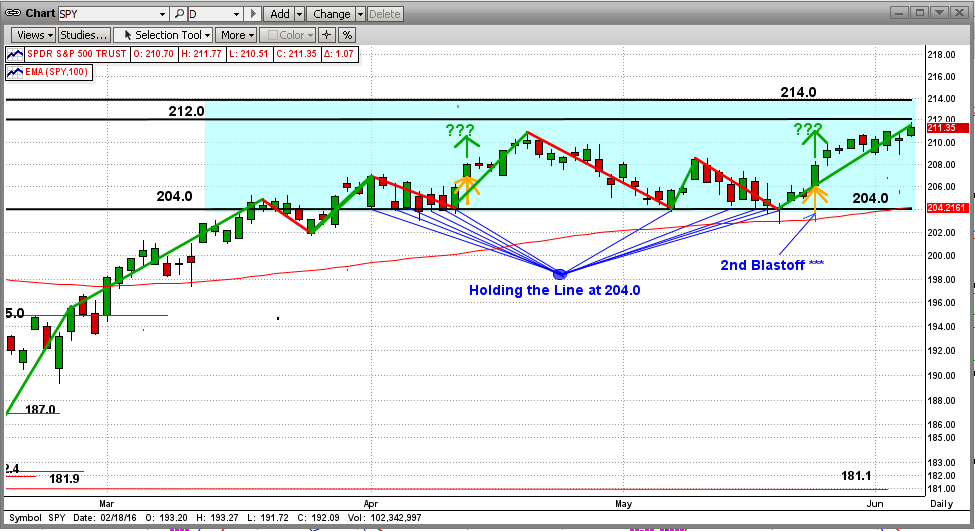
Since the beginning of 2016, the Bulls have fought off all market drops, and the S&P 500 is up for the year. In the last 2 months alone, the Bulls have offered very strong support at 204.0 on the SPY. To be exact, the SPY has amazingly hit and bounced up off of its 204.0 downside support level 12 times in the last two months (see graph below)!!!
We believe that the SPY "break-out" from 204.0 will be volatile and could lead to a major move up or down (i.e., new highs or a market crash). Or course, none of us know for sure which way the market will go from here, but we believe that MIPS will figure it out quickly. Stay tuned and watch closely !!!
Sunday, May 15 2016
Right above the 2nd graph below, we just added this:
Note: MIPS does not get "fooled" by the lag mentioned above and has called (and should continue to call) the drops/recoveries long before a single indicator like PRICE would. In 2008, MIPS was up over 50% !!!
-------------------------------------------------------------------------------------------------------------------------------
MIPS Members:
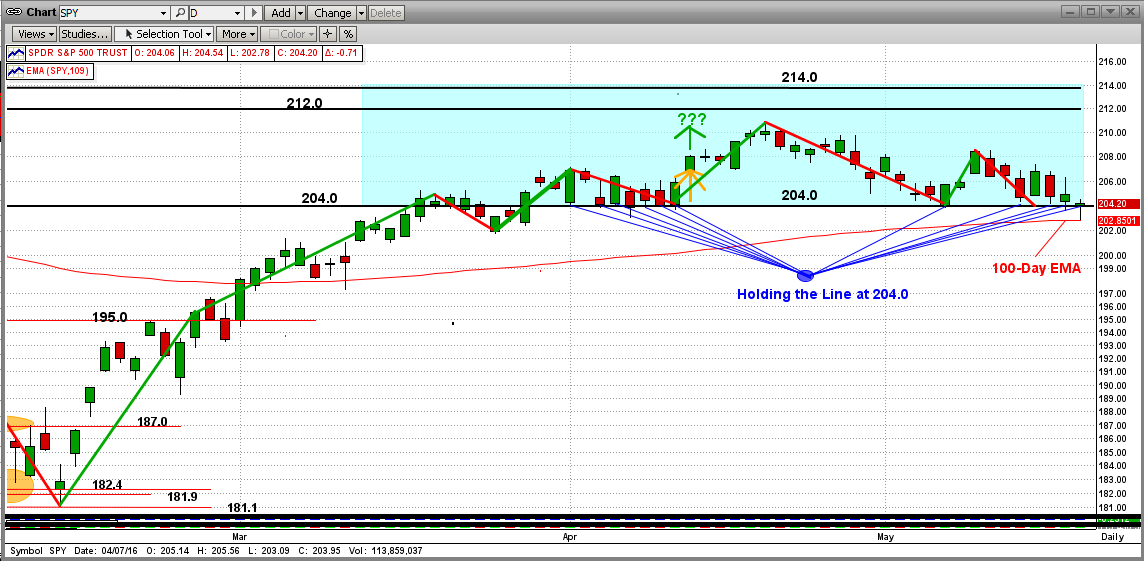
We are all wondering where this market will go from here. On Friday of last week, the SPY closed very near a critical point; almost right on the 204.0 support level and dead-on the 50-day EMA (green line in graph below). Of course, in the short-term, the market can move either way from here. We will rely on MIPS to tell us how to trade this market now.
LONG TERM...
At this time, after a 7-year Bull Market, it is interesting and prudent to start analyzing the longer-term outlook. Consider this ...
There are thousands of things that make the stock market move up and down all day long (daily cycles). And, there are others that affect what the market does on a longer-term basis; such as on daily-weekly cycles (short-term), monthly-quarterly cycles (intermediate-term), and annual cycles (long-term).
"Things" that affect short and intermediate-term cycles, (fundamental and technical) are overwhelming, such as:
- natural disasters (earthquakes, tsunamis, etc.)
- terrorist attacks
- foreign crisis (Greece, China, etc)
- tech leader failure (Apple, Amazon, etc.)
- economic growth
- consumer prices
- inflation
- stock values (extreme P/E ratios)
- companies earnings/profits
- Fed Action
- interest rates
- quantitative easing
- dangerously low oil prices
- sentiment
- etc., etc., etc.
Short/Intermediate Term
The above are impossible to predict, but the impact on the market from "all of the above" combined can be measured and analyzed on an intermediate-term basis. That is what MIPS does for us. MIPS uses applied mathematics, pattern recognition, artificial intelligence, and common sense to tell us if the intermediate-term trend is moving up or down. Furthermore, each decision is analyzed in light of what MIPS sees the "big guys" doing (that is, institutional investors, like Morgan Stanley, Goldman Sachs, etc.). MIPS does this by "weighting" market changes by trading volume, using our proprietary "volume-weighted data". Basically, this means that market changes on high volume have a greater impact on decision than market changes on low volume. Of course, since high volume can only come from the big guys, we are basically tracking what the big guys are doing (high volume is like their "foot prints" in the sand).
Long-Term
The long-term trend should be a little easier to predict because of one single indicator. This indicator is NOT a technical indicator. Rather, it is a core fundamental fact which always shows which way the market should/will be moving. I say "should" because it sometimes takes a while to "sink in" (lag); and I say "will" because the market WILL ultimately follow this indicator.
Of course, this is not something that I made up or discovered. Big, smart investors like Warren Buffett have followed this fundamental indicator throughout their entire careers. It's not a new one either, as it was emphasized in Benjamin Graham's book "The Intelligent Investor" in 1949. This non-magical indicator is companies' PROFITS.
Ultimately, the long-term trend in stock prices is driven almost 100% by profits, but sometimes with a few months lag. [I believe that stock prices start moving up or dropping a few months before profits move up or down because the fat kats (CEOs, top management, board members, institutional investors, etc.) know in advance what direction their companies' quarterly profits will be, and they (and their family/friends) take action long before the profits are released to the public.]
Note: MIPS does not get "fooled" by the lag mentioned above and has called (and should continue to call) the drops/recoveries long before a single indicator like PRICE would. In 2008, MIPS was up over 50% !!!
See the graph below (from StockCharts.com and www.RealInvestmentAdvice.com)

BEWARE
In the graph above, you can see that PROFITS "peaked" at the end of 2015, and have been DROPPING for over 1 year now. I believe that the Fed, and only the Fed, has been keeping stock prices high throughout 2015 with quantitative easing and extremely low interest rates. This is not good and cannot continue to happen forever. When the Fed's "tricks" no longer have a positive impact on stock prices, and if the US economy does not improved significantly, we will most likely have a drop in the stock market like in 2000 and 2008 (see graph below).
Good trading ...
|


