Friday, March 15 2019
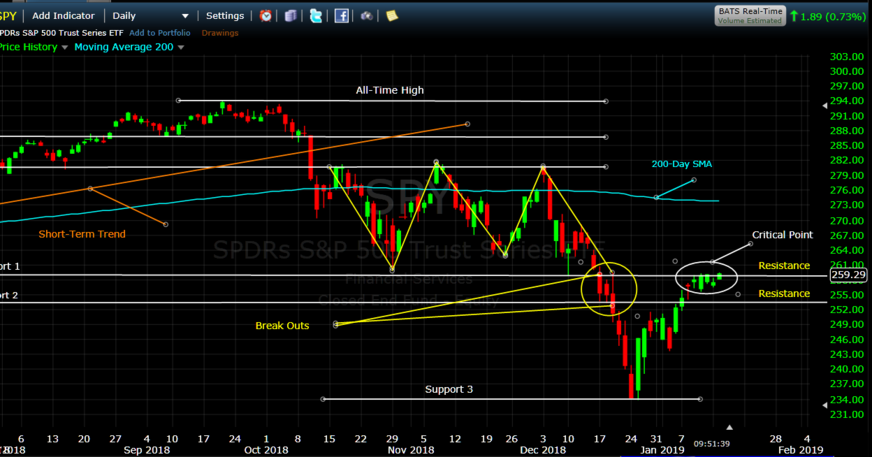
This may be the "Breakout" for the SPY that we have all been waiting (and hoping) for:
- see purple box on the middle right in the graph below
1) The SPY climbed to and hit the Resistance 1 level at $281/share,
2) and it stayed around there for about 7 days,
3) then in the next 5 days the SPY dropped to the 200-Day SMA level for support, and
4) moving average support held, and SPY rebounded back up to (and slightly above) Resistance 1 again.
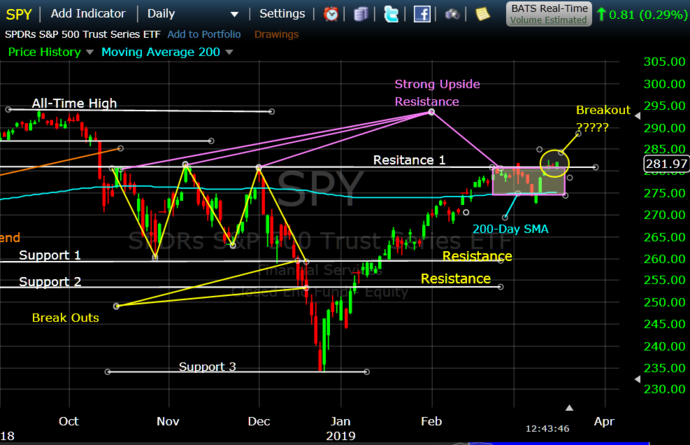
|
Let's hope for new highs next, but wait for MIPS to tell us what to do...
MIPS1234 and Nitro are sall till Long.
Good Trading...
Paul Distefano, PhD
MIPS Timing Systems, LLC
Houston, TX
281-251-MIPS(6477)
www.mipstiming.com
Tuesday, March 05 2019
There is a lot of talk (and a lots of good reasons) why we should strongly consider the possibility of, and even expect, the end of this market rally and/or the end of this 10 year bull market.
Current Rally
First, the current rally in the S&P 500 (SPY) has been "on" for two strong months (up over 20%) without looking back, and is now being challenged by strong resistance at $281/share. As you can see in the graph immediately below, the SPY has tried to break above $281 for the last 5 days in a row, and has failed to do so. And, exactly $281/share was the strong resistance price to the upside in the previous three rallies in 4Q'18. So, what's next?
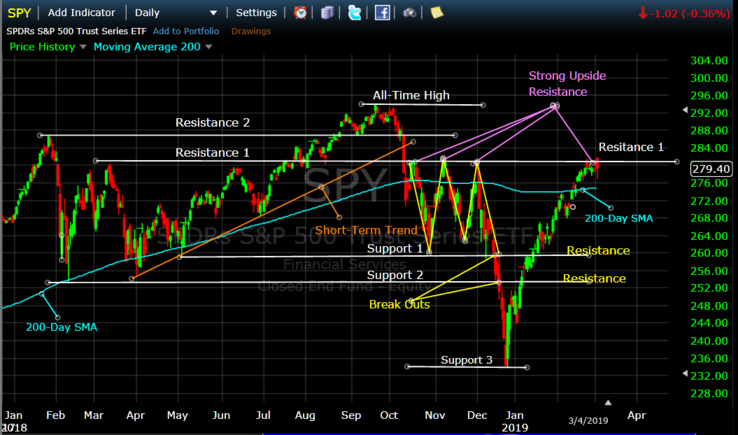
Longer-Term
There are a multiplicity of reasons why the long-term bull market that we have been in since 2009 may be coming to an end. We have what feels like the strongest political unrest in decades, the Fed and interest rates, China tariffs, overbought markets, slower earnings growth, etc. We are all aware of these and there is no reason to repeat them herein.
There is one other thing brewing that all investors should be aware of that could lead to a correction soon or even be the catalyst for a serious bear market. This threat is "Margin Debt". Margin Debt, of course, is the money that large investors and institutions have borrowed (hence, debt) to buy or short more equity positions than they have "real" money to cover. For example, qualified investors can buy $2,000,000 in equities with the $1,000,000 in cash they actually have (2.0x leverage) by "borrowing" the sceond $1,000,000 (debt). This is great ride when the market is going up. But with 2.0x leverage, if the equity they own drops say 25%, they will have lost 50% of their initial investment.
The above is why Margin Debt is dangerous for investors who owe the debt AND for us that don't. It is dangerous for these investors because of their leverage and it is dangerous for us because when the market goes against the investors who owe the debt (mainly very large investment firms and hedge funds), they run for the hills and drive the market down much quicker than normal (and innocent buy and hold investors can get cremated along the way).
Warning
Margin Debt is at an all-time high from all views (like total debt, or debt as a % of ownership, etc). See the graph below. The current level of debt is staggering, especially when compared to 2000 and 2008.
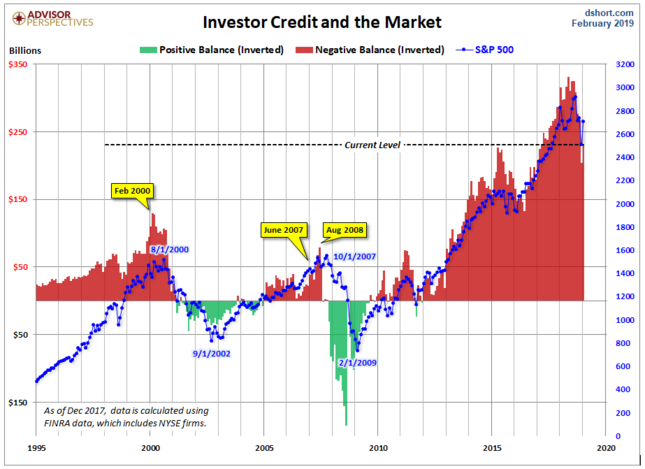
Observation
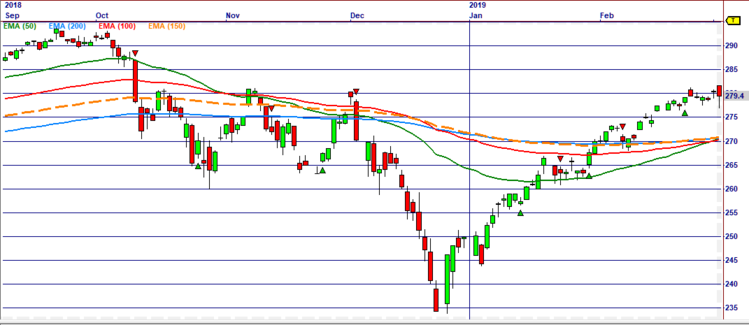
When stock markets roll-over from up-to-down, its moving averages roll-over from where the short term moving averages (50-day) are on the top and long-term averages (200-day) are on the bottom to where the short-terms are on the bottom and the long-erms are on the top. And, vice-versa for markets that move from down-to-up.
Note that in September 2018 the market was going up and the 50 was above the 100, and the 100 was above the 150, and the 150 was above the 200. Then, as the SPY tumbled in 4Q'18, by mid-December the moving averages had changed places with the 50 on the bottom and the 200 on the top. Since then, with the current rally, all moving averages have merged to the same price today, which kind of puts all market direction forecasts back to ground zero. So, where does the market go from here?
Wow, what can normal investors like us (the little guys) do in times like this. MIPS told us what to do in 2008 and we were up over 50% when the market was down more than 50%. So, we are going to wait for MIPS to tell us what to do in 2019.
Paul Distefano, PhD
CEO / Founder
MIPS Timing Systems, LLC
Houston, TX
281-251-MIPS(6477)
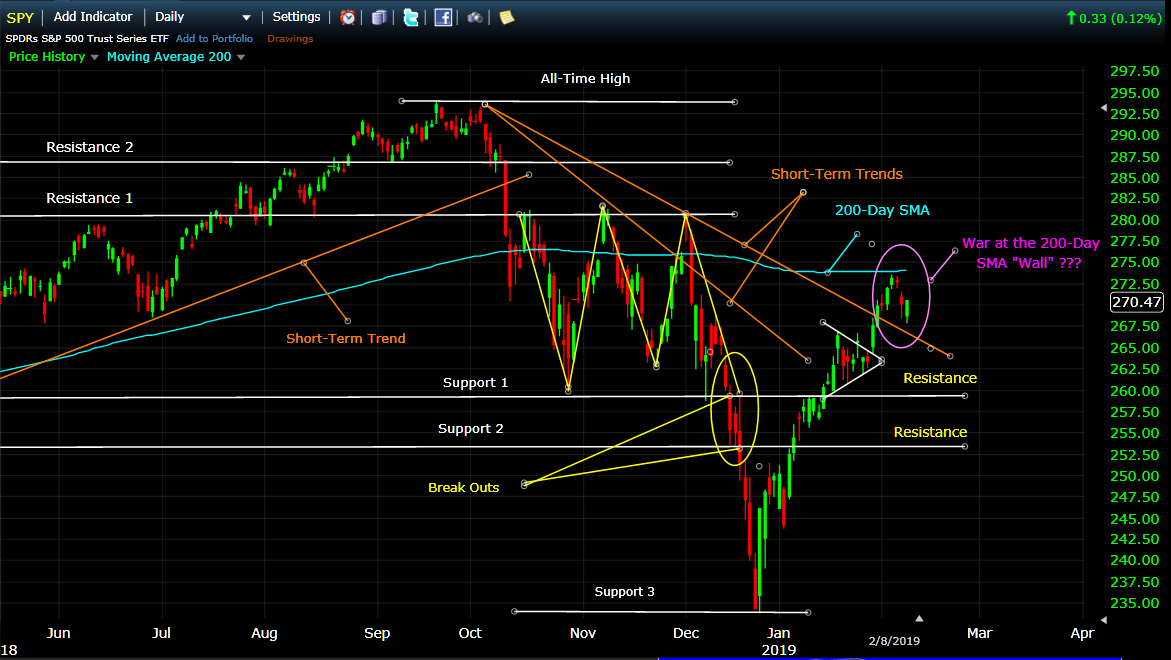
Sunday, February 10 2019
Interesting market movement last week:
As expected, the market ("SPY") declared a "War on its 200-Day Moving Average Wall" when it made an upward assualt on its 200-Day SMA. Sad to say, this first charge failed to break above the 200-Day SMA (see the purple ellipse on the right in the graph below). This market is fast moving and can go anywhere from here, so stay tuned, and
... let's wait for MIPS to tell us what to do next...
Paul Distefano, PhD
CEO / Founder
MIPS Timing Systems, LLC
Houston, TX
281-251-MIPS(6477)
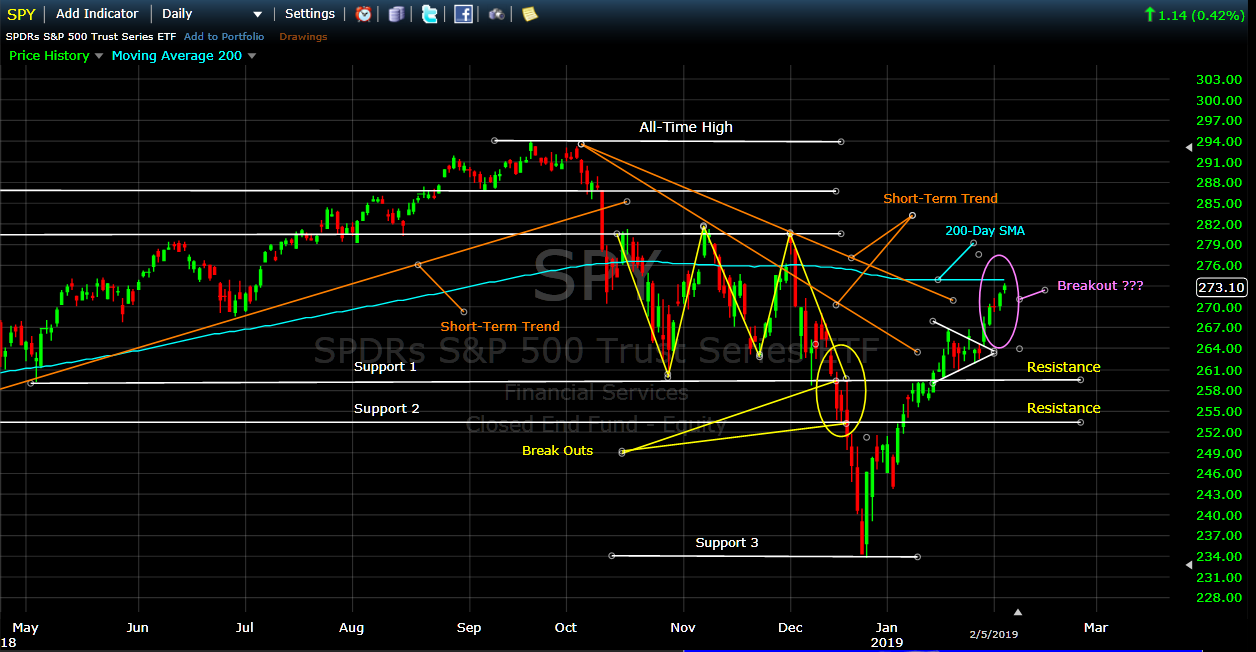
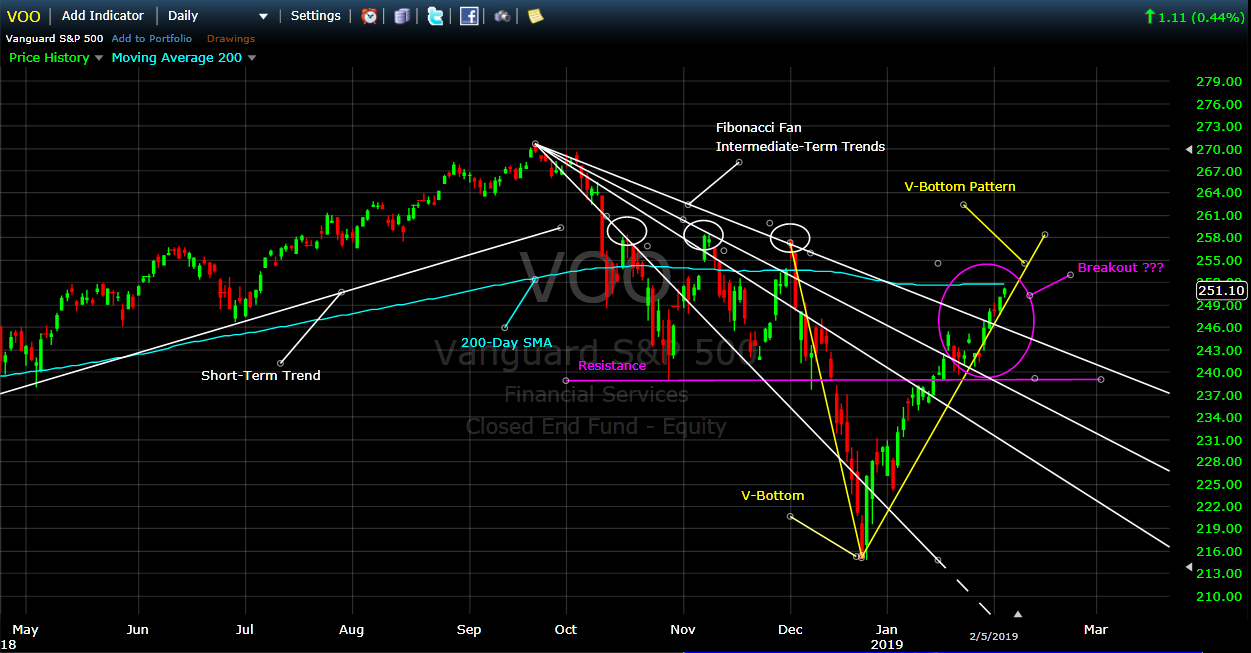
Tuesday, February 05 2019
What are the charts below trying to tell us to expect (see purple ellipse on right hand side):
1) continued breakout to the up-side (following the V-Pattern) to new highs, or
2) stiff upside resistance at the 200-Day Simple Moving Average level, and maybe a test of previous lows.
Stay tuned:
- I am going to let MIPS tell me what to do, and you should do the same.
Graph #1
Graph #2
Paul Distefano, PhD
CEO / Founder
MIPS Timing Systems, LLC
Houston, TX
281-251-MIPS(6477)
Sunday, January 27 2019
Some time ago, I would have been surprised at the negative inputs that MIPS is getting from "some" (small number) of its members because of the high number of trades (9 trades) that the MIPS models have issued in the last 90 days. But, I am really NOT surprised because we had almost an identical response from other members in 2017 when the MIPS models did the opposite, and had No trades for the entire year (yes, zero).
In this blog, we will attempt to explain the high number of trades from MIPS in the last 90 days; and we will refer to our previous Blog from Nov 19, 2017 to explain the lack of MIPS trades in 2017. Over the last 13 years, the MIPS models have averaged about 12 trades/year, with 20+ in some years and 0-2 in others.
Popular quantitative models are based on concepts such as:
1) Trend Following - following short, intermediate, or long-term trend lines
2) Reversion to the Mean - Reverses when the markets get over-bought or over-sold
3) Momentum - puts more trust in markets that are moving in one direction, with higher or lower movements
4) Rate of Change - highly affected by markets when the slope of the movement is growing or decaying,
5) etc, etc, etc.
MIPS
MIPS is basically a trend-following model, but has algorithms built in to recognize over-bought and over-sold markets, markets that are gaining or losing momentum, and especially markets that are moving sideways (forming a recognizable "Consolidation Pattern").
MIPS behaves differently in slow and fast moving markets, up markets, down markets, and flat/sideways markets. In 2017, the market moved as a strong up-market for the entire year, so there was no need to "trade" just to trade, at the risk of being "fooled" by small dips. So, MIPS detected that, and did not trade at all that year.
On the other hand, since 3Q'18 we have been in a flat/sideways market. This is VERY dangerous market pattern, because there are basically NO identifiable trends (flat trend), and most other indicators are in chaos also. In fact, trying to identify market direction in this type of market is like trying to figure out who is winning a battle of thousands of warriors in hand-to-hand combat !!!
In this type of market, the MIPS models are programmed to go into a "preservation of capital" mode; which essentially means that, to be "safe", the models will go into (and stay in) Cash more often. So, instead of trades being long-to-short, most will be long-to-cash-to-short (and vice-versa for short-to-long trades). With this approach in 2018, the MIPS models ended up with small gains instead of big losses from getting whipsawed like many other quantitative models.
MIPS Gains in the last 3 years
The goal of all timing models should be to keep up with (or do a little better than) the market (S&P 500) in up markets, and to beat the market (or at least not lose money) in down markets. If you want to beat the market in strong up markets, you should do so by trading with 25% (1.25x) leverage or 50% (1.5x) leverage on Long Signals. On Short Signals, you should traded with 0.5x or 1.0x leverage.
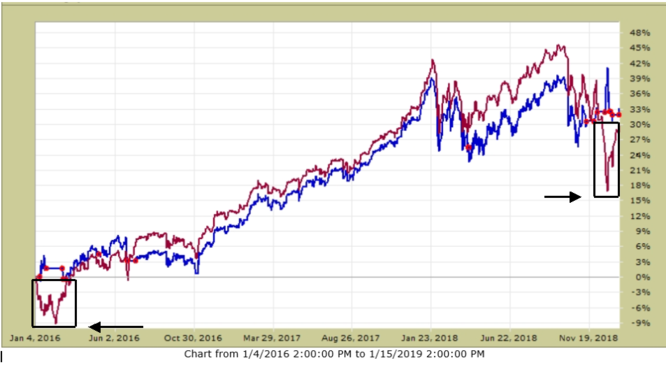
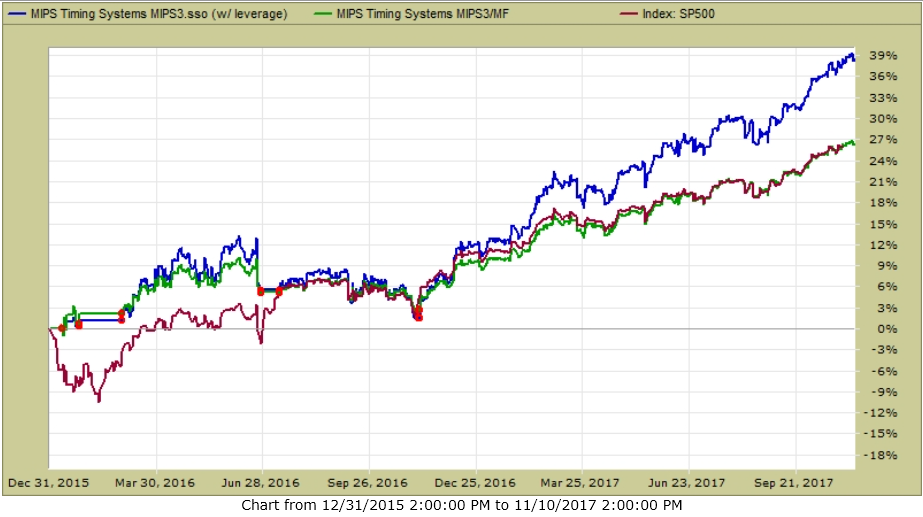
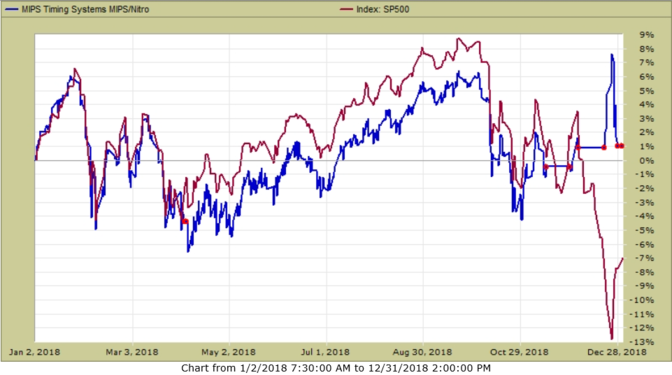
Overall, since the beginning of 2016 thru 01/15/2019, MIPS is up about 33%, while completely avoiding the big drops in the beginning of 2016 and in the last few weeks in 2019. Of course, this means if you were trading with $100,000 you would have ended up with about $33,000. Not bad since your trading advice from MIPS would have been only $39 or $59 per month for 3 years !!!
2016 - 01/15/19
MIPS - Blue Line
SPY - Red Line (big drop boxes are drops in the SPY)
Red dots show actual trades
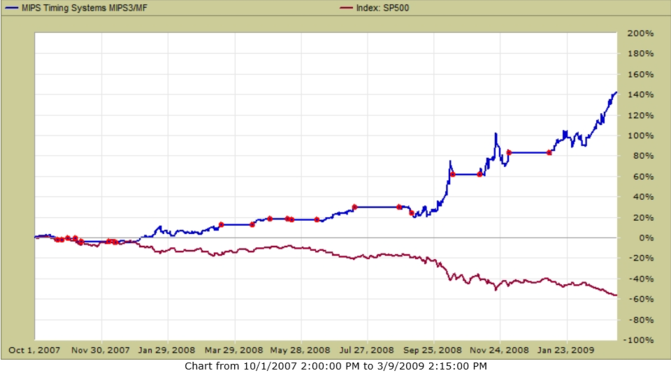
2008 - Market Crash
With good quantitative models, the "magic" comes in down markets. Notwithstanding the analysis above the graph above, the big payback comes in unanticipated years when the market crashes, as in 2008. The graph below shows what MIPS would have done for you in 2008, with no leverage.
In the 2008 crash (4Q'07-1Q'09), with MIPS Signals you would have been up +140%, while with buy-and-hold you would have been down -55% (yes, LOST 55%). Again, while investing with MIPS signals your $100,000 investment in Oct'07 would have been $140,000 at the end of 1Q'09 (+40%). On the other hand, with buy-and-hold your $100,000 investment in Oct'07 would be $55,000 at the end of 1Q'09 (-45%). That's a spread of $85,000. You do the math and see if that performance would be worth $39/month !!!
2008 Crash
MIPS - Blue Line
SPY - Red Line
Red dots show actual trades
BTW, trading just the SPY and SH (or any other two ETFs), it should take only 10 minutes to make a trade. So, 12 trades/year (24 round trip) would use up a max of only about 4 hours of your time per YEAR. If you cannot or will not spend that much time managing your life savings, you should either buy-and-hold or hire a money manager (most charge a fee of about 1.5% er year, and require a minumun investment of about $100,000).
Best Wishes !!!
Paul Distefano, PhD
CEO / Founder
MIPS Timing Systems, LLC
Houston
281-251-MIPS(6477)
www.mipstiming.com
===========================================================================
<<< Previous Blog >>>
Saturday, November 18 2017
Some investors (including some MIPS members) seem to think that when there is not a position change (Signal Change) in a MIPS model for a long period of time, they are being ignored or something is wrong with the model that they are following. They can't seem to understand that a good model (like MIPS) only changes position when the market changes its behavior, and that change is detected by the model. With MIPS, this would be when the intermediate-term market "trend" changes direction. We at MIPS input data and run our models daily (in triplicate), independent of whether or not there is a change of any type.
All daily model developers (including MIPS) provide their subscribers with "Investment Positions" (Long or Short or Cash) about 250 days every year (52 weeks/year x 5 trading days/week - holidays). This is not a function of how often their models trade.
There is, however, a big difference in how these "Investment Positions" are reported amongst model developers (aka Signal Providers):
1) Some Signal Providers send out emails to subscribers with current positions every trading day, whether or not the signal has changed. Many subscribers do not like this because they get inundated with emails from their Signal Provider and many times they miss a "signal change" due to confusion or boredom.
2) Other Signal Providers only send out emails to subscribers when there is a change in position from their model. Subscribers don't like this because there can be long periods of time (weeks/months) when they don't hear from their Signal Provider, and hence they are not 100% sure that they did not miss a signal change somewhere along the way or that the Signal Provider is now inactive.
3) At MIPS (as with most other good Signal Providers), we send out
(a) A "Signal Change" email the very day that one of our models calls for a change in position
(Long-to-Short or Short-to-Cash or etc.)
(b) A "Signal Status" email every weekend showing the current position for all MIPS models.
Our subscribers like this because the "Signal Status" tells them if they are in the correct
position at that time.
The moral of this story is that MIPS runs its models each and every day, no matter what the market is doing. This includes the status and behavior of hundreds of technical indicators and mathematical equations, and thousands of calculations. it is NOT any easier to run the model when the current signal remains the same or when there is a signal change.
We report the results to you every time there is a Signal Change, with instructions on our website for you NOT to change this new position until there is another Signal Change issued by the MIPS model that you are trading with. In the meantime, we keep you up-to-date on the Signal Status for each MIPS model every weekend, in case you accidentally did not act on the latest Signal Change during the week.
Here are the trades (red dots) and performance of the MIPS3 model since 2016
Blue Line - MIPS3 1.5x Long / 0.5x Short +39%
Green Line - MIPS3 1.0x Long / 1.0x Short +27%
Red Line - SPY........................................ +27%
Red dots show actual trades
Best Wishes...
Paul Distefano, PhD
MIPS Timing Systems, LLC
Houston, TX
281-251-MIPS(6477)
Tuesday, January 15 2019
Today is a critical day in 2018-19's sideways market's short-term future. These type of sideways markets (also called "Flat Markets" or "Consolidation Patterns", etc.) usually have no direction, trend, etc. So, MIPS handles these with "Preservation of Capital" algorithms, rather than "Capital Gain" algos. In this blog, we use SPY (SP500 ETF Index) to represent "the Market".
For the SPY to go back to all time highs following a "Correction" (as in 2018), it must pass through multiple "upside resistance levels" where the market stalled on the way down. [BTW, these were called "support levels" on the way down.]
Today is what I call a "Critical Day" because the SPY is at an upside resistance level where it has "stalled" for the last five days in a row (and these attempts to cross over upside levels are not that tolerable). So, for the latest mini-rally to continue, it is very improtant that the SPY closes above its resistance level at about $259/share today or in the next few days.
See the botton right in the 2nd graph below...
COMPLETE SIDEWAYS MARKET
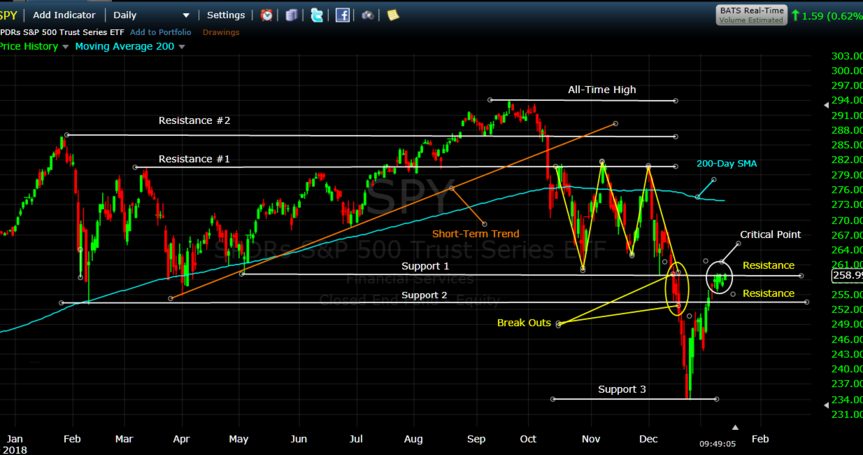
CRITICAL POINT TODAY
Stay tuned... MIPS had a surprise for you today... did you check your email last night or this morning?
Paul Distefano, PhD
CEO / Founder
MIPS Timing Systems, LLC
281-251-MIPS(6477)
www.mipstiming.com
pdistefano@mipstiming.com
Wednesday, January 09 2019
2018 was an unusually volatile market with all hell breaking loose in the 4th quarter. If we need an explanation, the catalysts would again be the Fed raising interest rates, tariffs, trade agreements with China, Mexico and Canada, domestic and international political unrest, etc. And, it is indeed odd that this happened when the economy is still in relatively good shape. For example, in December 77% more new non-farm jobs were created versus the prior period. If the economy had any impact on the market, it would be because the troublemakers made up any and all excuses to scare investors into thinking that the economy is weakening, thus causing a sell off. Then the fat kats come back in and buy at prices much lower than what would have been possible before.
That said, the market is beginning to look like it is entering a “topping" pattern that we have seen before in each and every major market crash in the last 20+ years. In 2015, the Global Central Bank interventions prevented or postponed a crash. Crashes don’t normally happen suddenly and quickly; they usually waffle in a tight trading range (like plus to minus 6 to 7%), and then they drop like a rock. Is that what is happening now? I don’t know, but we should find out in a relatively short period of time from here.
.
The 4th Quarter was a Disaster !!!
Meet the monster…
The market volatility type in 4Q'18 is one of the most difficult for quantitative models.
Some of the major problems weree:
1) Trendless - a flat or sideways market has no trend. The slope of the trend is near zero, so any small
deviation from the trend could seem to signal a "direction change", and this can lead to a series of
“whipsaws”.
2) Oversold and overbought conditions do not register nearly as often as the market changes direction
quickly.
3) Reversion to the mean signals could trigger at tops in sideways patterns that happen in an up market,
but they rarely trigger on market bottoms in these type markets.
4) Since most models available to large individual investors and RIAs are based on daily data (instead
of like minute-by-minute or second-by-second data), it can take a few days for models to issue a new
buy/sell/cash signal. And, when sideways markets are changing direction every few days (high-
frequency-directional-changes), the market can change direction a day or two after each trade is
executed, time after time. We all know what that leads to, and it is NOT pretty.
MIPS Performance in 2018…
Actually, MIPS performed OK in 2018 (like, did not lose money in a down market). MIPS was up about +1%, while the S&P 500 was down about -7%. Many other quantitative models took a beating in 2018.
From TimerTrac.com MIPS +1% Standard & Poors 500 -7%
Red dots represent "trades"...
Here Comes 2019…
2019 is starting off with a Bang...
.
China remains a headache but it is not overbearing. And, our economy remains strong.
There are billions of dollars flowing back into the market so far in Jan’19. The market got a boost from the Fed after Chairman Powell said the Feb will be “flexible and patient" regarding rate hikes in 2019. Last Friday, earnings reports showed 312,000 new jobs created in December versus 155,000 created in November, and 180,000 “expected” in December. Can’t beat that !!!
In 4Q’18, Corporate earnings growth has average 15.4%, with Corporate revenue growth of 6.2%. Average hourly wages rose 0.4%, the largest gain in 4 months. The year-over-year wages growth is about 3.1%.
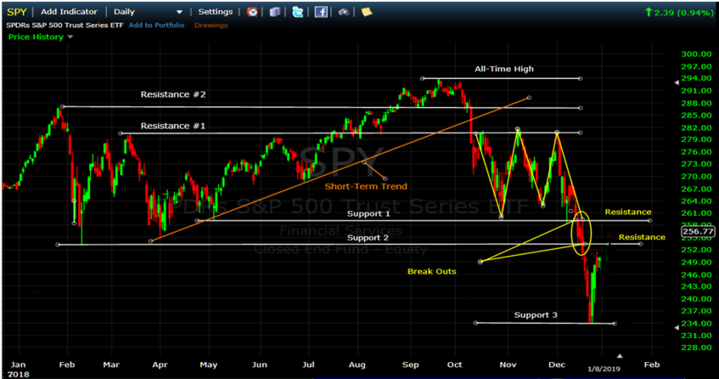
After a strong recovery in the last four days in Dec’18 and in the first six days in Jan’19, the SPY has “recaptured” a little over 50% of the “drop” that started in early Dec’18. See graph and text below...
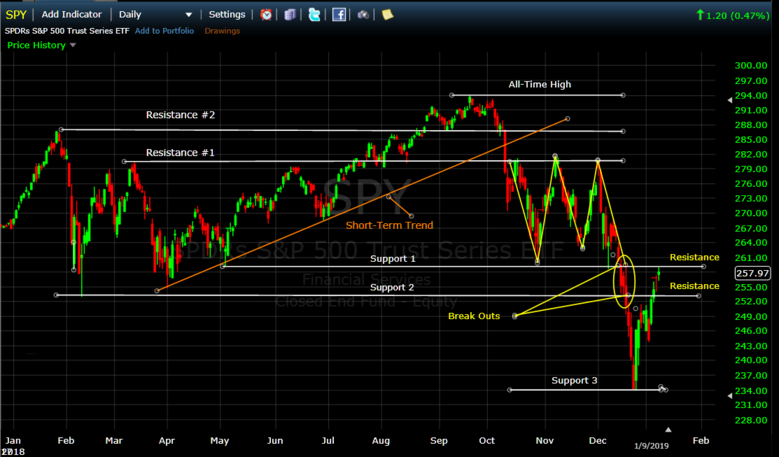
The challenge going forward is for the SPY to break above the second Resistance levels on the right hand side of the graph above. On Monday (Jan 7th) the SPY broke above its first Resistance level at 253.1; and then it stalled right on the second Resistance at 259.1 today (Jan 9th). It is highly likely that the SPY may stall at this level for a few days or even drop back below it.
On the other hand, if the SPY breaks above 259.1, it would most likely move up significantly to test its higher resistance levels shown above (or even move into new high territory). Although not expected at this time, the SPY could of course, just as easily head back down to test the support levels below today’s price. That could result in a drop to 234.1, or lower. And, it if breaks that level, we will head for the hills (that is, go Short and make money).
Stay tuned. It’s anybody’s guess, but MIPS is watching…
Good Trading…
Paul Distefano, PhD
CEO / Founder
MIPS Timing Systems, LLC
Houston, TX
www.mipstiming.com
281-251-MIPS(6477)
Thursday, January 03 2019
It is important that you understand why most of the MIPS models have recently (last 2 months) been issuing many more trade signals than they would under "normal" times. [And, no... there is nothing happening that the MIPS models cannot handle, as has been the case with many other models in 2018.]
Remember, between the twelve years of 2007-2018, the MIPS3, MIPS4, and MIPS/Nitro models have traded an average of 12-15 trades/year; with some years trading 4-5 times and others trading 15-20 times.
The MIPS models are known for being able to avoid getting whipsawed in flat/sideways markets that can last 10-15 months. Our models do this mainly by either keeping the position that it had going into the flat market (long, short, or cash) or simply by going to cash often. That is mainly why the MIPS models traded only twice in the first 10 months of 2018. From the graph below, in these 10 months, you will see some "wobbling" in the 1st quarter (where MIPS only traded twice) and then a rather strong "Short-Term" trend line (brown line in graph) from the end of March to the middle of September (where MIPS stayed Long). So, during this time, the MIPS models were mostly Long, and traded only twice.
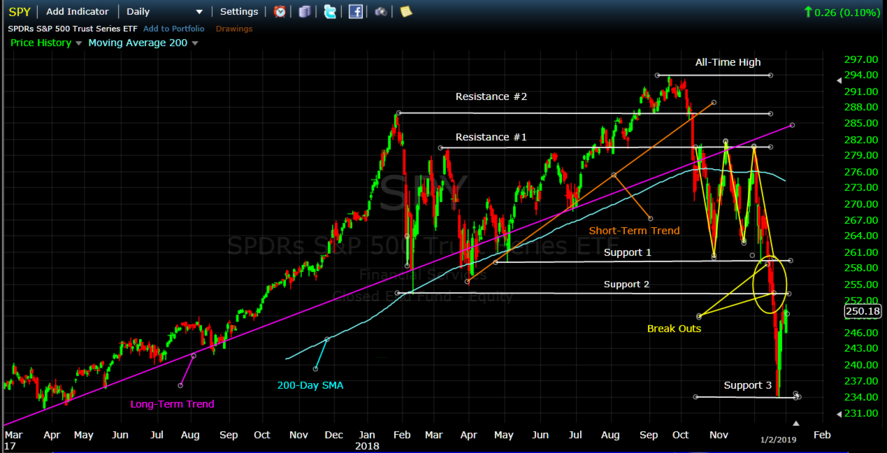
However, from the middle of October to the middle of December, the SPY went sideways again in something like a pattern-within-a-pattern (see the yellow trend lines between Resistance 1 and Support 1 forming a "W" Pattern). After the SPY broke out of the bottom of this pattern, as is the case most of the time after a market "breaks out" of a flat pattern, all hell breaks loose and high volatility becomes the norm. [See yellow "Break-Outs" to the downside near the bottom right in the graph below.]
This is where MIPS (and most other quantitative models) have their most trouble. In situations like this, MIPS goes into a "kind of" defensive mode, and seeks to limit losses. When there is any doubt of a sustained market direction, MIPS may simply go to Cash. And, to avoid getting whipsawed, the MIPS models internally build a "no-man-zone" around a potential trigger point. And, instead of the MIPS trade signals going from say Long-to-Short, the models will go to Cash in the "no-man-zone", with the result being trades like Long-to-Cash-to-Short (instead of just Long-to-Short). Of course, the same thing happens on potential Short-to-Long trades.
FYI- The MIPS models issued 10 trades in 2018, two in the first quarter and eight in the 4th quarter. This is not the norm as the modes trade as the trend trades (or to limit losses).
With these type of tactics built in, the MIPS models managed to provide gains of 1-3% in 2018, depending on the model; whereas the SPY benchmark lost around 6.5%.
While some models did better, other well-known and well-respected models lost between 6-15% for the year.
BTW, the drop from the top in September to the bottom in December was about 20%, and some people had to drink with that on New Year's Eve !!!
Happy New Year !!!
Paul Disetefano, PhD
CEO / Founder
MIPS Timing Systems, LLC
Houston, TX
281-251-MIPS(6477)
www.mipstiming.com
Support@mipstiming.com
Sunday, November 25 2018
All investors want to know which way the market is (and will be) moving. But, most do not care "why" the market is doing what it is doing. On the other hand, some investors are trying to figure out why the market is doing what it is doing. Some concentrate on "fundamentals" and others on "technical analysis".
"Fundamentals" include things like the condition of the economy, corporate earnings growth, employment, consumer confidence, international relationships, politics, etc. Of course, you have no trouble getting inundated with info about these from talking heads, advisory services, emails, etc. However, once you get all of this "stuff", you still have to determine which way the market will move given all of the info above, and when !!!
At MIPS, we concentrate on "technical analysis" which means that we are calculating which way the market will move going forward compared to today's movements. Since we are using hundreds of technical indicators, applied mathematical equations, artificial intelligence, pattern recognition, volume weighting, etc., we can project the market in the near future based on the outcome of the above. For example, our "volume weighting" algorithms tells us if a big price change in the market on any given day (like in the S&P 500, SPY) was caused by trading from "the pros" or from us "little guys". Along with hundreds of our other algos, the MIPS models are highly successful in calling directional changes in the market (like with 65-70% accuracy), and the winning trades are over three times more profitable than the losses on losing trades.
ACTUAL FLAT MARKETS
Given the above, the question "what kind of market" are we in takes the front row. So, "what kind of market" are we in? The short answer is that we are in what is called a flat, sideways, horizontal, or trendless market, which means a market that has gone up and down in a tight trading range of something like plus or minus 3-6% around a meanline (or mid-line) for several months. See "example" below.
FLAT MARKET IN 2015
Flat/Sideways markets can be very dangerous to trade in, especially those that change direction every few days (like every 4-7 days). We call these High Frequency Directional Change (HFDC) patterns, and this is where most non-suspecting models get whipsawed badly. In 2015, the Dow changed direction 29 times in the first 9 months, which caused most models bad headaches (like that below). Since that time, we have built in multiple algorithms to limit trading with the MIPS models in flat markets.
FLAT MARKET IN 2018
What is going on in the market now? Let's look at this from both a long-term and short-term view.
Long-Term View
When looking at the SPY with a long-term view (immediately below), the flat/sideways pattern is obvious, as it was in 2015. The flat market in 2015 ultimately broke to the upside, but we will have to wait to see what happens now.
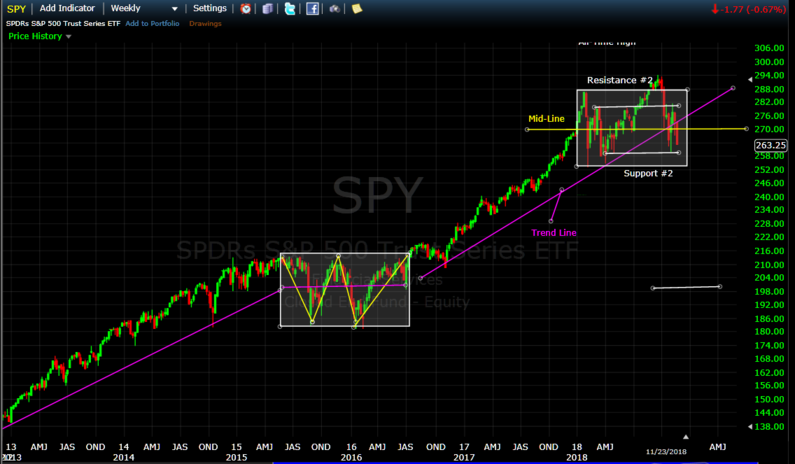
Short-Term View
The graph below shows the "mess" that we are in now. This market has crushed many timing models, because it has no predictable "direction". Fortunately, the "Blaster Series" algorithms that we implemented in 1Q'16 have protected the MIPS models from trading in markets like this. Now, the MIPS models either stay in the position they were in when the flat market started, or they go to cash when the market movements make no sense at all (like now).
In the graph below, you can see that the SPY has traded between $253-278/share since Jan'18 (approximately plus or minus 5%, between resistance/support #2). And, if you look closely at the smaller trading range that we are in now in the right side of the graph below (with support#1 and resistance #1 between $260-280), you will see no trend or meaningful pattern (which means that the next market move is highly unpredictable). However, a break of the #1 support/resistance lines will at least deserve immediate extra caution.
The MIPS models haved remained Long since Apr'18 and issued a "Cash" signal on 11/13/18, to have been executed on the open on 11/14/18 at $274.16/share. Remember, the cash position can change at any time.
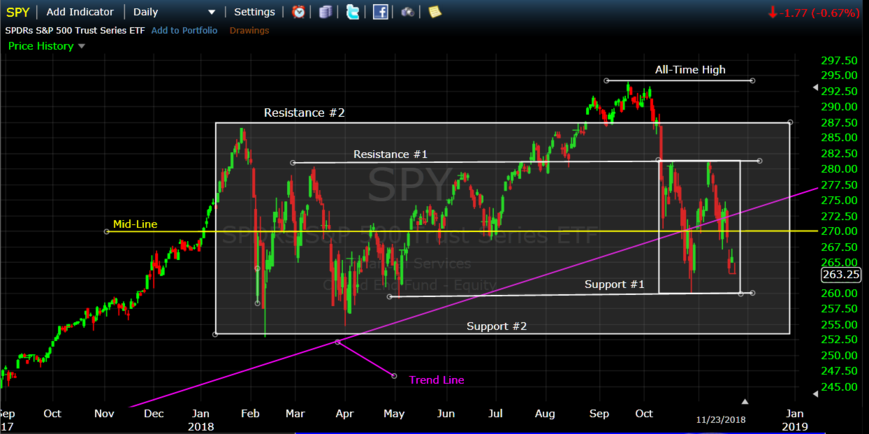
So far, our last signal is a profitable one, and the future remains unpredictable now. But, that can change on any given day, so be careful and watch for MIPS Signal Change emails.
And remember, when tradiing actively, "Money not made is NOT the same as money lost" ...
- so, it is better to sit on the sidelines than to trade and lose.
Good trading...
Paul Distefano, PhD
CEO / Founder
MIPS Timing Systems, LLC
Houston, TX
281-251-MIPS
www.mipstiming.com
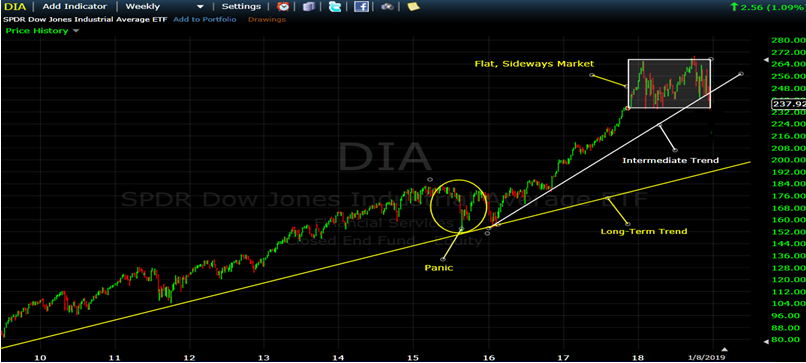
Sunday, November 11 2018
It seems like everyone (at least almost all MIPS members) are deathly afraid of a fast market crash from today's levels. Fortunately, that is not usually the way market crashes happen (and there is a good reason why). I say usually because the market can do what it wants, when it wants. But, understanding human nature and previous market behaviors under similar circumstances can be helpful.
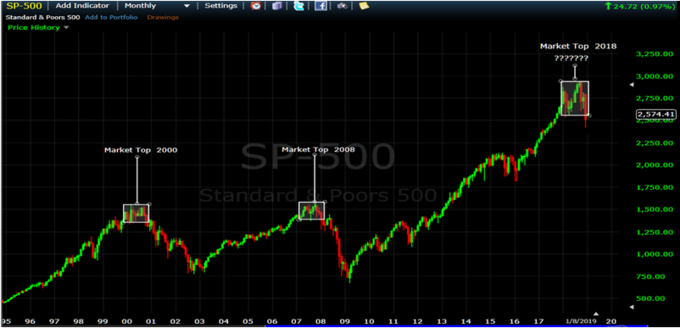
First off, market crashes do NOT just fall out of the sky on any given day. A market "topping" that leads to a 1-2 year bear market (40-60% drop), takes 10-12 months to "prepare" for the drop. See the market "toppings" and crashes for the SPY from 2000 and 2008 in the graph below.
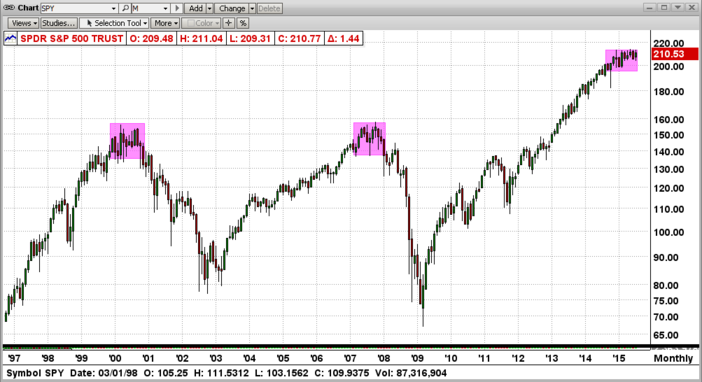
"TOPPINGS"
In the above graph from between 1997-2016, you can see the 12-15 months "toppings" that led to the bear markets in 2000-2008. During these "topping" stages, the market "waffled" for 10-12 months before falling apart. Everyone that studies market behavior through quantitative analysis has their own opinion, but I am 90-95% sure that the topping period lasts 10-12 months because (and only because) it takes the FAT KATS (Morgan Stanley, Goldman Sachs, etc) that long to dump a sizeable portion of their holdings or at least to re-allocate their holdings. After that, the fat kats open the gates and us little guys fall through the bottom. In 2015, the fat kats changed their minds after about 1/2 of the way thru the "topping" period and decided to reverse their course (leading, of course, to many new highs through 2Q'15).
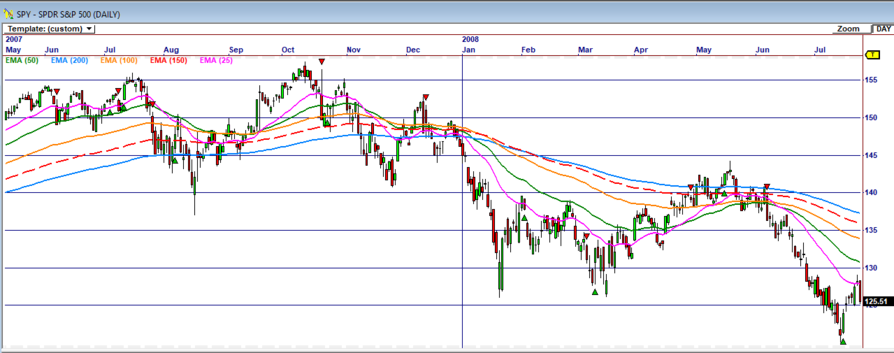
During a topping or roll-over period in the market (if that is what it is), a good timing model (or technical analyst) can see the "slow" deterioration of the market. See one simple example of the market rollover (SPY) in the market crash of 2008 (graph immediately below). In mid-2007, the 25-50-100-150-200 day exponential moving averages were aligned to where the short-term moving averages were above all of the long-term ones (as in all up-markets) until the market got weaker-and-weaker. At the beginning of 2008, the entire group of moving averages "inverted" themselves (flipped) to where the short-term averages were on the bottom (as in all down markets). After the moving averages "inverted", the market experienced a horrific ride to a -55% bottom !!!
TODAY
The possibility of a big market "drop" now or in the very near future, is not nearly as justified as it was in 2007 (we are in what is more likely a sideways or horizontal market). The short-term averages (like the 25-day and 50-day EMAs) have just started to penetrate below the long-term average space, and most likey all will turn around before dropping more.
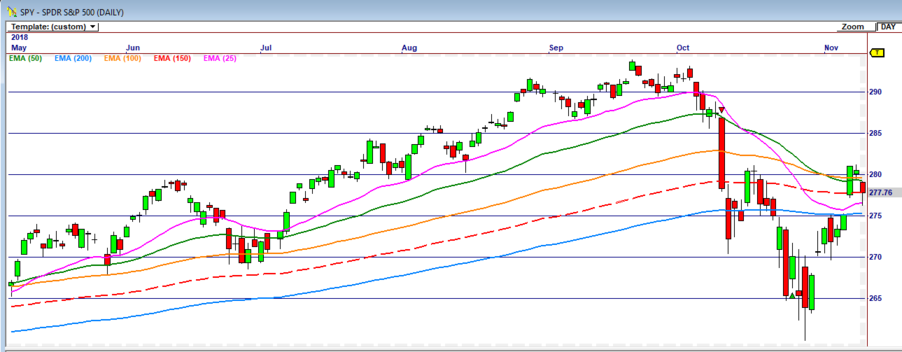
From the above, there is no indication that the market is close to a "crash" at this time. See the graph above, and remember that the market can do what it wants, when it wants.
SO, WHAT DO WE DO?
In a market crash, MIPS is designed to go short somewhere around a 10% drop, and recover after ABOUT a 10% recovery. This means, for example, that if the market is down -55% and MIPS takes 10% on each end to issue trade signals; and if MIPS performs as designed, MIPS would be up +35% when the market is down -55%. Between Oct'08 and March'09, the SPY was down about -50% and MIPS was up over +100% (it caught some "upticks" in this bear market). See below:
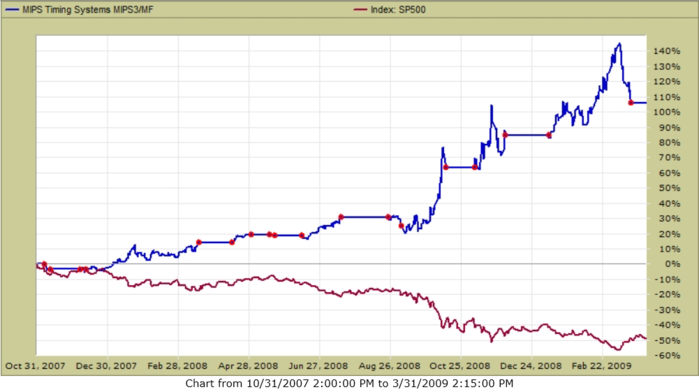
Example:
The above is an close examination of the behavior of the 25-50-100-150-200 day EMAs, but it is only ONE of the indicators/algorithms that are used in the MIPS models. Please remember that MIPS uses OVER 200 technical indicators and mathematical algorithms to determine if the market is moving up or down !!!
Good trading...
Paul Distefano, PhD
CEO / Founder
MIPS Timing Systems, LLC
Houston, TX
281-251-MIPS(6477)
pdistefano@gmail.com
www.mipstiming.com
|


