Wednesday, April 11 2018
The MIPS3, MIPS4, and MIPS/Nitro models issued two “signal changes” (trades) in just three days last week, after being in a Long signal position for over 15 months. Lots of MIPS members have asked us for an explanation.
The MIPS models are very complex models that use more of our own proprietary mathematical algorithms (applied math, pattern recognition, artificial intelligence, etc.) than simple tactical indicators. In total, however, “votes” from over 150+ technical indicators and market behavior algorithms decide in which direction “the market” is moving (for us, “the market” is the S&P 500 Index, or SPY).
OFFENSIVE SIGNALS
Please understand that we run the MIPS models each and every day from scratch. When a MIPS model indicates, with a strong degree of confidence, that the direction of the market has changed, it will issue a “signal change” and this goes out in an email to MIPS members (and is updated on the MIPS website immediately thereafter). Of course, if the model does not identify a new change in the market direction with high confidence that day, it will keep the same position (Long, Short, or Cash). And, this can go on as long as the market keeps growing (or declining) as in the last 15+ months. In all of the above cases, we call these signals “Offensive Signals”, and over 80-90% of our signals are Offensive (see Defensive Signals below).
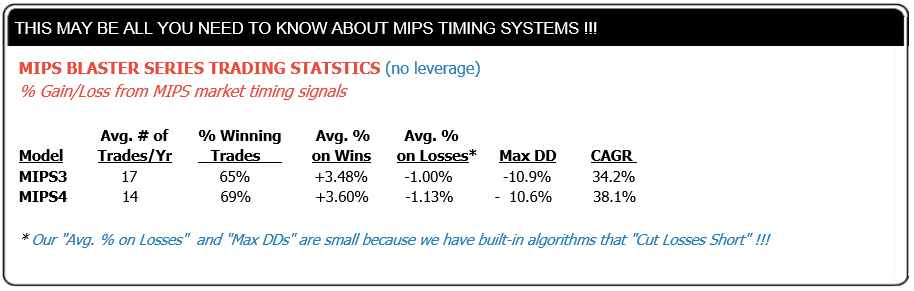
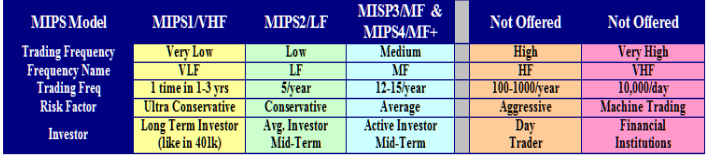
Now, things get interesting (and pseudo confidential for all recipients). To understand this Blog from here on, please take a second to “study” the table below (from the Home page on our website).
DEFENSIVE SIGNALS
MIPS3 has been tracked and its signals have been verified since Nov 2005. MIPS4 is a more recent model and is slightly better than MIPS3. So, let’s concentrate on MIPS4 for this blog. BTW, the results in the table above result from the MIPS models with the Blaster Series algorithms.
What is obvious in the above table is that, on average, the MIPS4 models traded a little over one time per month, the trades were winners almost 70% of the time, the CAGR was almost 40%, and the maximum drawdown was just a little over -10%.
The stats above are all great, but there is “one thing” that all MIPS members should be aware of and be happy about. I am sorry to say that we have been publishing this chart for years, and we have gotten very few questions about one important entity in it. If one digs a little deeper, they would realize that this “one thing” that makes such a huge improvement in performance is that the average GAIN on winning trades is +3.5%, but the average LOSS on losing trades is only -1.1%. That is pretty good proof that a timing model that is programmed to automatically “cut its losses short” is working with darn near perfection.
This is NOT a Coincidence!!!
The much lower average LOSS above does not “just happen”, but rather it results from highly effective “stops” that we designed and built into the MIPS models. The MIPS very low average LOSS is only about 1/3 of the size of its average GAIN. If we had done nothing in the MIPS models to cut LOSSES, instead of the average loss being -1.1% as it is now, it is highly likely that the average loss would be close to the opposite of the average gain (or about -3.5%). The reason that we defined our “stops” with quotation marks is that our “stops” are NOT derived simply from a designated loss from the last actual initial trade or from a trailing high. Our "stops" are designed so that, as a MIPS model “learns” about its most recent bad performance (e.g., it losses 3-4 days in a row, or it losses 4 days out of 5, and many more), other algorithms take over and either reverse the current signal or takes the model to a Cash position.
We have many of these proprietary “stops” built into all MIPS models, and they can either take a new Long or Short signal that is not working well to Cash, or they can take a Cash signal that is being left behind in performance to a new Long or Short position !!!
The MIPS models are more likely to issue both offensive and defensive signals quickly in relatively flat, horizontal market patterns than in markets with a strong up or down trend with low volatility; but it can happen at any time. The Defensive signal algorithms In our MIPS models work exceptionally well, and this is one reason why our average losses are so low.
LAST WEEK and 2018 YTD
The MIPS3, MIPS4, MIPS/Nitro models that had been long for over 15 months issued two trade signals last week (a Cash signal on 4/3/18 and a Long signal on 4/5/18). Since 4/2/18, all of the MIPS models are up approximately +1.5% as of the close on 4/10/18; but the MIPS models are down -4.6% for the year.
Good Trading !!!
Paul Distefano, PhD
CEO / Founder
MIPS Timing Systems, LLC
Houston, TX
281-251-MIPS(6477)
Sunday, April 01 2018
What a surprise !!!
After an almost straight up market since the presidential election in Nov’16, the market kind of “exploded” in 1Q’18.
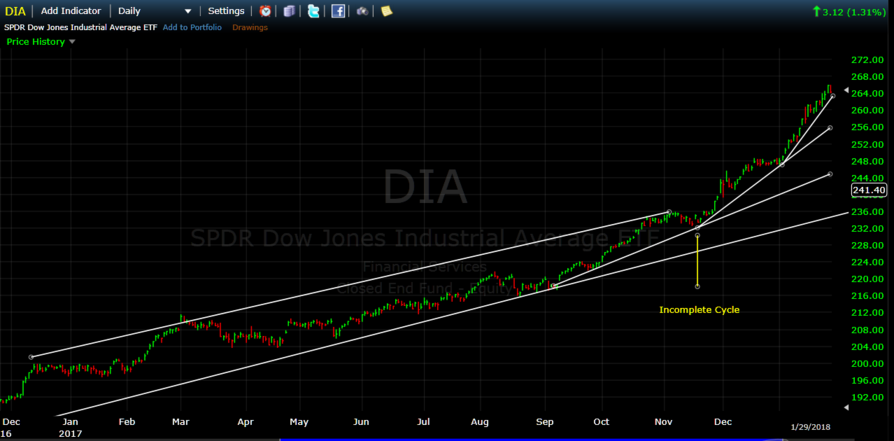
However, it should not have been such a big surprise if one had only paid attention to the market performance several months before the explosion. For example, it can be seen in the graph immediately below that, instead of the market completing its normal up-down cycle in the channel below in November 2017, it "blasted off" like a cannon ball until all indices were greatly overbought by the end of January 2018.
2nd Graph
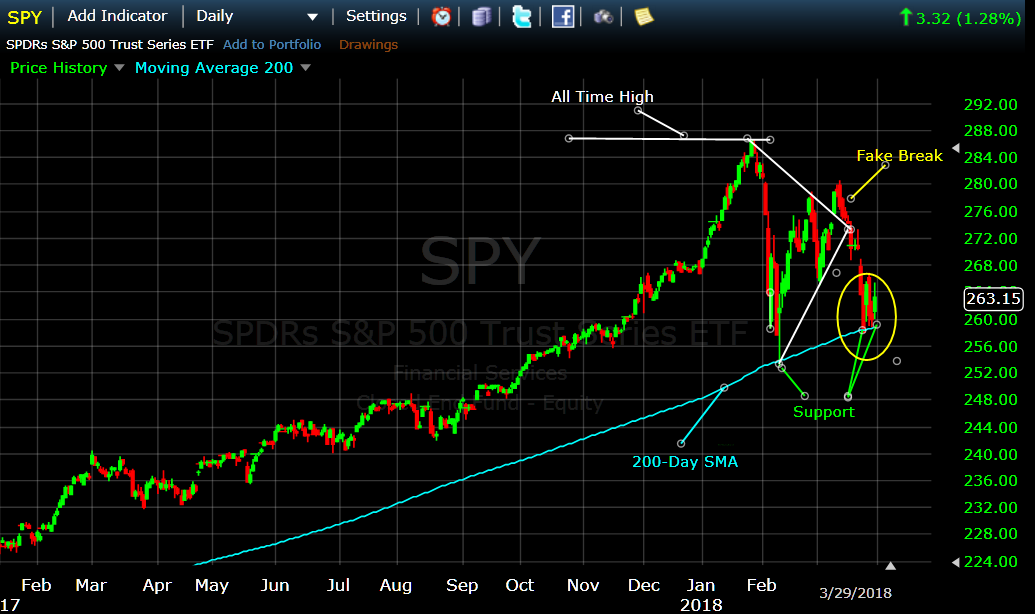
In an overbought situation like this, it usually does not take a big catalyst to start the market spiraling down. In this case, it was things like Trump’s tariffs, talk of trade wars, uncertainty with North Korea, investigation of Russian collusion, etc. For whatever reason, it happened and the results were not pretty. Since there are no free lunches in the stock market, after the big 4th quarter 2017 run up it seems like all professional traders decided to dump their winners and “take profits” on the first bad news in 2018. Of course, this action indeed prompted the market to explode (see graph below). If this continues, things could really get ugly.
On the other hand, it is now at least some form of comfort that the market (SPY) tested its Support Level (200-Day SMA) five trading days in a row, and it bounce back up on Thursday, March 29th (see the very last 5 bars at the “Support Level” on the right-hand side in the chart below).
It seems that the SPY got high enough above its trend line that “reversion-to-the-mean” mentality took over and drove the market back down to its 200-day SMA support level. Hopefully (and most likely) the market will continue up after testing the support level and having the bulls win (i.e., the market may have drained the overbought swamp).
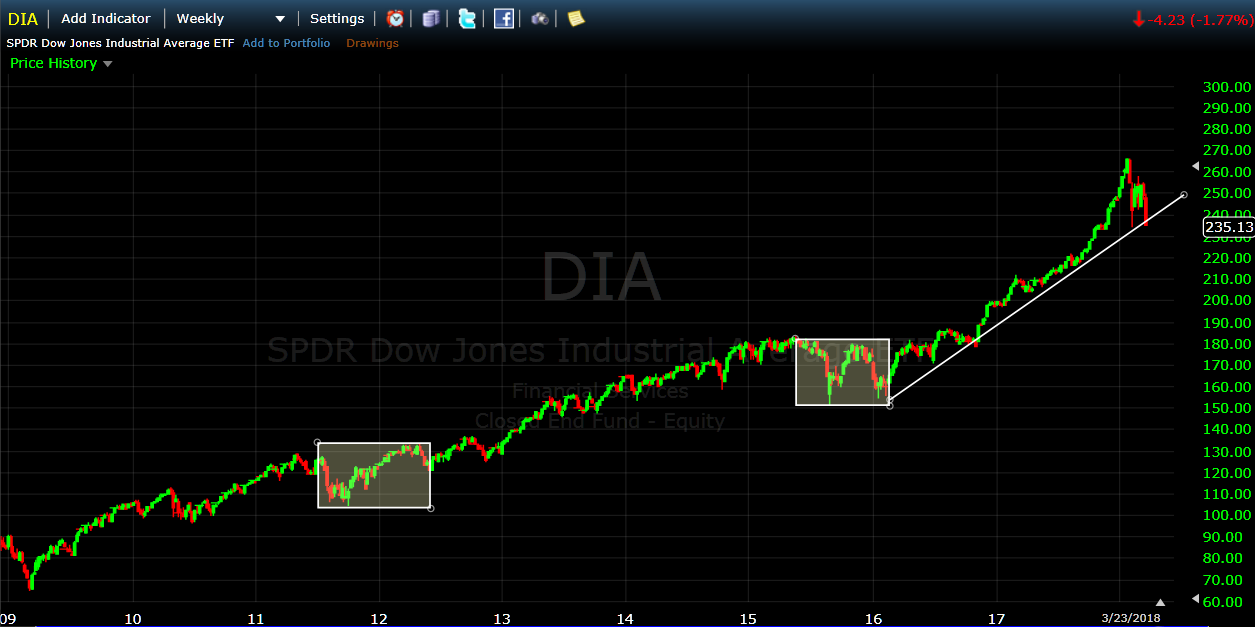
Graph #3
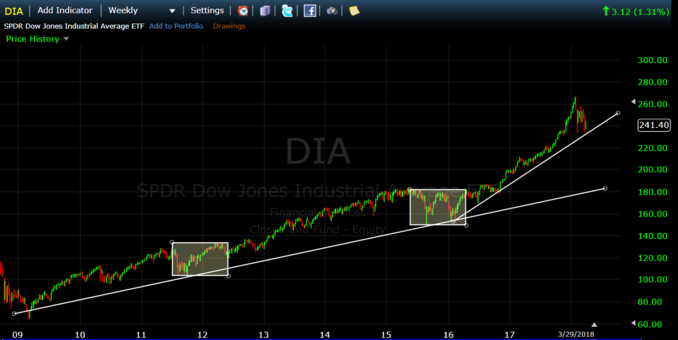
If we step back and look at the steep, steady growth in the market since 2009 (graph below), and if we compare the last 2 years’ performance to the prior 8-year uptrend, it is easy to see why the MIPS models have traded only a few times since the beginning of 2016. In most cases, models that chased every “dip” in the market over the last 10 years ended up getting whipsawed at least a few times along the way. More trades DO NOT automatically lead to better performance as many people think (and in most cases the opposite is true).
BTW, when one looks at the “explosion” in February 2018 from a long-term perspective as in the graph below, it can be seen that relative to the prior growth in the market, the drawdown in 1Q’18 does not seem so “damaging” after all. From a mathematical standpoint, the MIPS models have a form of “relativity” built in. This means that algorithms that could signal a “sell or short” with a dip of 3-4% in a flat or slow growth market, might ignore a dip of 8-9% in a very high growth market (as in the last 2 years).
First Quarter of 2018
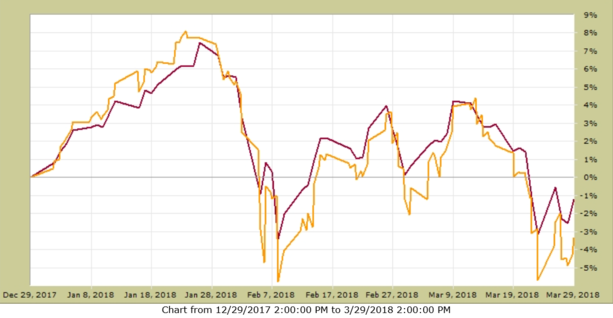
Even with the great degree of volatility in the market in 1Q’18 and the big drop in the SPY from its highs, the MIPS3 (and MIPS4) models performed exceptionally well in 2007-2017, and only lost back -3.5% in 1Q'18.
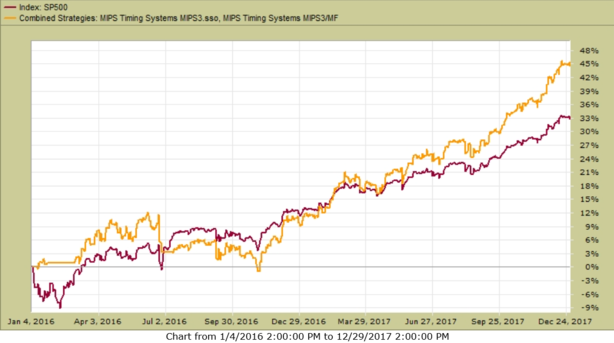
MIPS3 Model
Trading SPY with 1.5x Leverage Long and 0.5x Short
The MIPS3 model gained +45% in 2016-2017 and it only lost back -3.5% in 1Q’18
2016-2017
1Q'18
PS – Lots of analyzing (and guessing) going on here, and that is why we use MIPS to tell us what to do with a MUCH GREATER degree of accuracy.
Good Trading…
Paul Distefano, PhD
CEO / Founder
MIPS Timing Systems, LLC
Houston, TX
281-251-MIPS(6477)
Sunday, March 25 2018
There are many trading models/strategies that are categorized as being in the High Frequency Trading domain.
However, that definition has greatly different meanings depending upon what type of investor it is referring to.
A simplified broad range of “investors” is something like that below:
- Individual Investors like us (10-80 trades/year)
- Day Traders (4-5 trades/day)
- Machine Trading (1000’s of trades/day)
Over 90% of day traders lose money and machine trading is out of our reach. So, for the purpose of this blog,
let’s concentrate on individual investors.
In the category of “Individual Investors” there is at least three different kind of investors
1) buy-and-hold investors,
2) investors somewhat like buy-and-hold investors that use timing models to tell them when to buy/sell, and
3) Investors somewhat like day traders that believe that timing models that trade more often produce better
results.
.
The purpose of the blog is to show our MIPS members the FLAW in category #3 above. There are certainly
times when the market moves from up-to-down, and then from down-to-up in such a fashion that good timing
models can track the market successfully, and there are times when this is not the case.
Bad timing models chase every single dip in the market no matter how small, and regardless of whether or not
the market has actually changed direction (new trend). Good timing models (like MIPS) are extensive enough
to judge if the dip is “sufficient enough” for investors to change their position (long, short, cash) and/or if the main
trend has changed direction. And, good timing models have mathematical models built in that can ascertain the
“relatively” of the dip compared to the recent past. For example, with a good timing model, a 3% dip may issue a
signal change in a market that has been flat or in very low growth, whereas it may take an 8-9% drop for the
model to issue a signal change in a market that has grown 20-25% in the last 6-12 months. Models that are not
good enough to determine the above can trade 60-100 times per year with pathetic performance (mainly because
they trade on almost every single dip with no additional analysis).
Below is an example of a market that should not require an average of over 10-15 trades/year in the period of 2009-18.
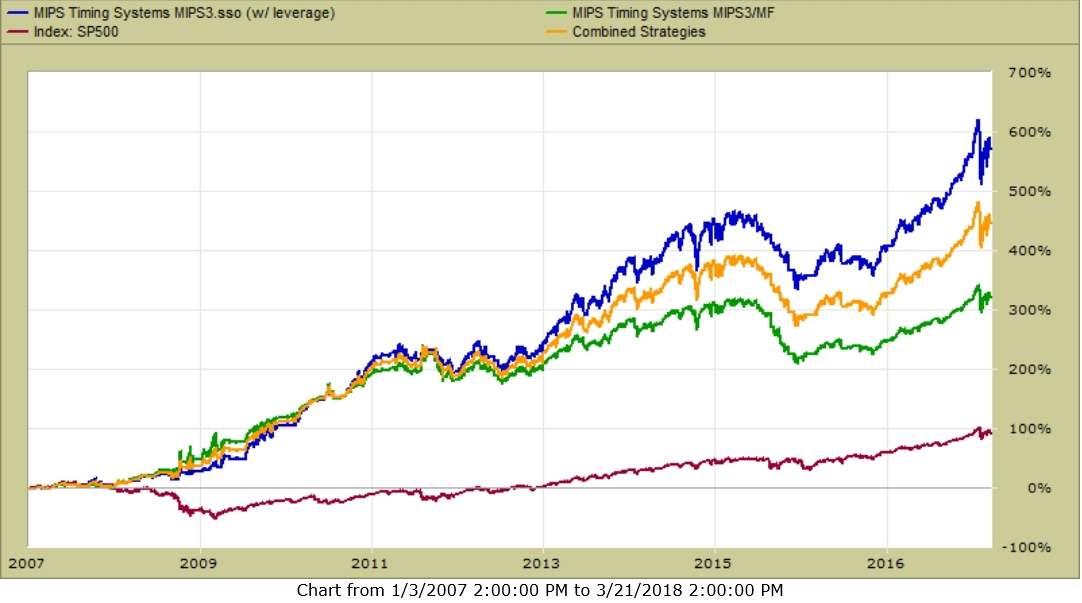
The graph below shows the MIPS3 model performance 2007-03/21/2018
- the performance definitely defines MIPS3 as a “good model”
MIPS3 trading SPY Long/Short
- Blue Line -- 1.50x Long / Long Only
- Orange Line – 1.25x Long / 0.5x Short
- Green Line – 1.00x Long / 1.0x Short
TRADING FREQUENCIES
The charts and graphs below are from TimerTrac.com. Our objective is to analyze the relationship between trading
frequencies of the 20+ best timing models on TimerTrac.com versus their 2-year and 10-year performances. This
certainly teaches us a lesson, but is not a very comprehensive study for professionals.
ELEVEN YEAR PERFORMANCE (2007-2017)
- The MIPS3 model issued 129 trades in this period (average of 12 trades/year)
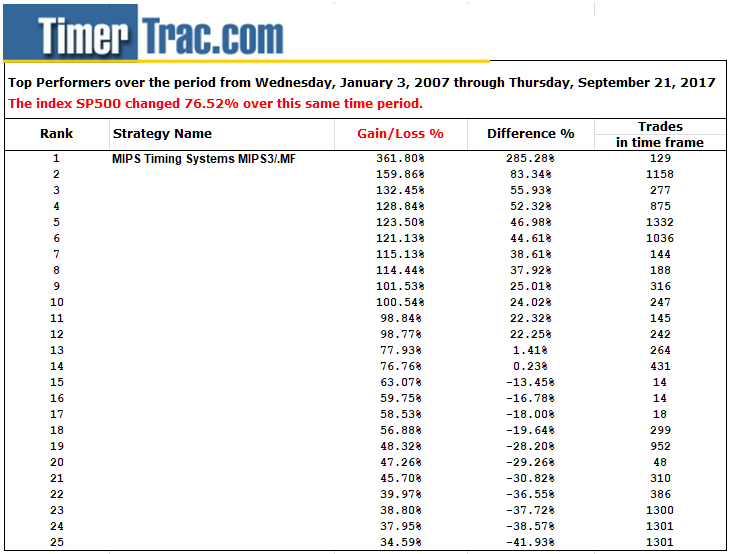
Performance
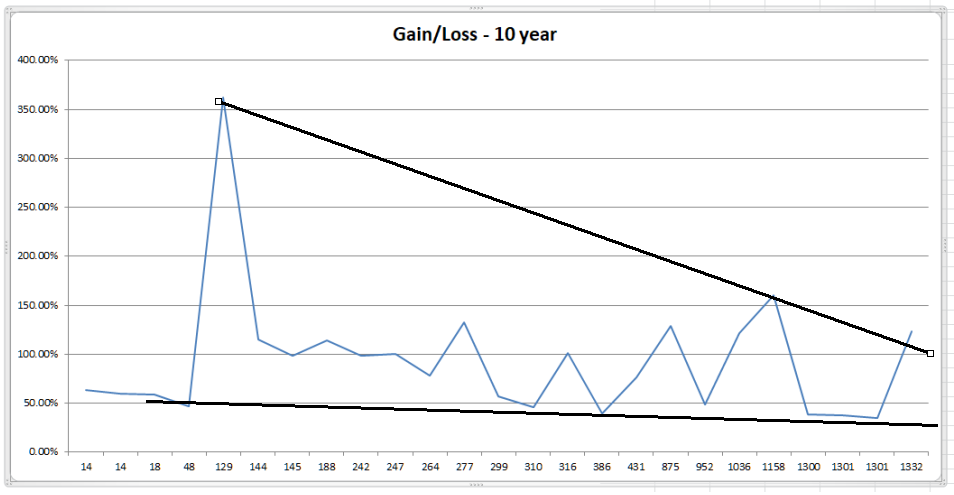
Number of Trades issued between 2007-2017
-----------------------------------------------------------------------------------------------------------------------------
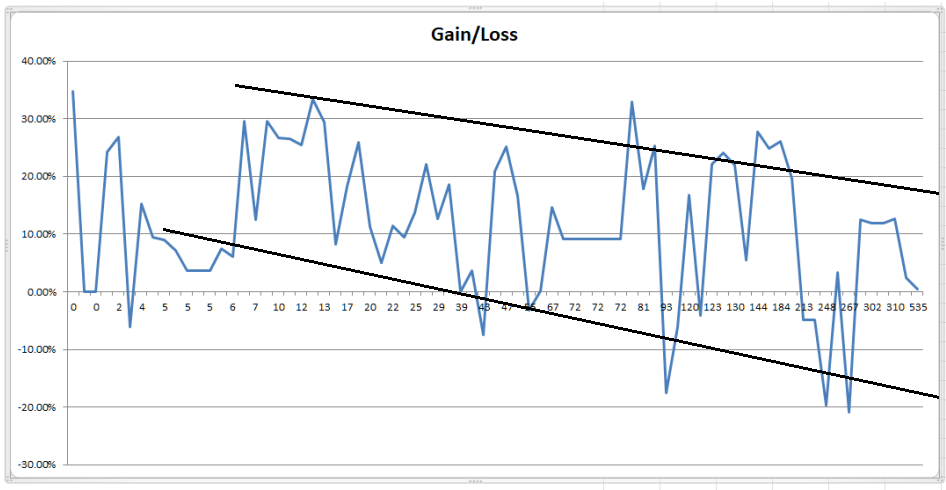
TWO YEAR STUDY (2017-2018)
- The MIPS4 model issued 9 trades in this period (avg. 5 trades/year)
|
Top Performers over the period from January 3, 2016 through September, 2017
|
|
|
The index SP500 changed 34.75% over this same time period.
|
|
|
|
|
|
|
|
|
|
Ranking
|
|
Strategy Name
|
Gain/Loss %
|
Difference %
|
Trades
|
|
1
|
|
|
34.74%
|
0.00%
|
0
|
|
2
|
|
|
33.42%
|
-1.32%
|
13
|
|
3
|
|
|
32.94%
|
-1.80%
|
77
|
|
4
|
|
MIPS Timing Systems MIPS4/MF+
|
29.61%
|
-5.14%
|
9
|
|
5
|
|
MIPS Timing Systems MIPS3/MF
|
29.57%
|
-5.18%
|
7
|
|
8
|
|
|
29.49%
|
-5.25%
|
13
|
|
9
|
|
|
27.68%
|
-7.06%
|
144
|
|
10
|
|
|
26.85%
|
-7.89%
|
2
|
|
11
|
|
|
26.71%
|
-8.04%
|
10
|
|
12
|
|
MIPS Timing Systems MIPS2/LF
|
26.45%
|
-8.30%
|
10
|
|
13
|
|
|
26.13%
|
-8.61%
|
184
|
|
14
|
|
|
25.86%
|
-8.88%
|
19
|
|
15
|
|
|
25.39%
|
-9.35%
|
12
|
|
16
|
|
|
25.30%
|
-9.44%
|
88
|
|
17
|
|
|
25.18%
|
-9.56%
|
47
|
|
18
|
|
|
24.90%
|
-9.85%
|
169
|
|
19
|
|
|
24.23%
|
-10.51%
|
1
|
|
20
|
|
|
24.03%
|
-10.71%
|
124
|
|
21
|
|
|
22.10%
|
-12.65%
|
123
|
|
22
|
|
|
22.07%
|
-12.68%
|
29
|
|
23
|
|
|
21.97%
|
-12.78%
|
130
|
|
24
|
|
|
20.81%
|
-13.94%
|
44
|
|
25
|
|
|
19.73%
|
-15.02%
|
193
|
|
26
|
|
|
18.54%
|
-16.20%
|
38
|
|
27
|
|
|
18.27%
|
-16.48%
|
17
|
|
28
|
|
|
17.81%
|
-16.94%
|
81
|
|
29
|
|
|
16.70%
|
-18.04%
|
120
|
|
30
|
|
|
16.68%
|
-18.06%
|
52
|
|
31
|
|
|
15.31%
|
-19.44%
|
4
|
|
32
|
|
|
14.62%
|
-20.13%
|
67
|
|
33
|
|
|
13.76%
|
-20.98%
|
25
|
|
35
|
|
|
12.67%
|
-22.08%
|
29
|
|
36
|
|
|
12.65%
|
-22.10%
|
310
|
|
37
|
|
|
12.47%
|
-22.28%
|
302
|
|
38
|
|
|
12.45%
|
-22.29%
|
7
|
|
39
|
|
|
11.91%
|
-22.83%
|
302
|
|
39
|
|
|
11.91%
|
-22.83%
|
302
|
|
40
|
|
|
11.47%
|
-23.28%
|
22
|
|
41
|
|
|
11.21%
|
-23.53%
|
20
|
|
43
|
|
|
9.49%
|
-25.26%
|
5
|
|
42
|
|
|
9.49%
|
-25.25%
|
23
|
|
44
|
|
|
9.21%
|
-25.54%
|
72
|
|
44
|
|
|
9.21%
|
-25.54%
|
72
|
|
44
|
|
|
9.21%
|
-25.54%
|
72
|
|
44
|
|
|
9.21%
|
-25.54%
|
72
|
|
44
|
|
|
9.21%
|
-25.54%
|
72
|
|
44
|
|
|
9.21%
|
-25.54%
|
72
|
|
45
|
|
|
8.96%
|
-25.78%
|
5
|
|
46
|
|
|
8.28%
|
-26.47%
|
14
|
|
47
|
|
|
7.40%
|
-27.34%
|
6
|
|
48
|
|
|
7.20%
|
-27.54%
|
5
|
|
49
|
|
|
6.03%
|
-28.71%
|
6
|
|
50
|
|
|
5.46%
|
-29.28%
|
134
|
|
51
|
|
|
4.99%
|
-29.76%
|
21
|
|
52
|
|
|
3.67%
|
-31.08%
|
5
|
|
52
|
|
|
3.67%
|
-31.08%
|
5
|
|
52
|
|
|
3.67%
|
-31.08%
|
5
|
|
53
|
|
|
3.59%
|
-31.16%
|
41
|
|
54
|
|
|
3.40%
|
-31.35%
|
253
|
|
55
|
|
|
2.36%
|
-32.38%
|
523
|
|
56
|
|
|
0.42%
|
-34.32%
|
535
|
|
57
|
|
|
0.18%
|
-34.56%
|
61
|
|
58
|
|
|
0.02%
|
-34.72%
|
39
|
|
59
|
|
|
0.00%
|
-34.74%
|
0
|
|
59
|
|
|
0.00%
|
-34.74%
|
0
|
|
60
|
|
|
-3.16%
|
-37.90%
|
55
|
|
61
|
|
|
-4.15%
|
-38.89%
|
121
|
|
62
|
|
|
-4.86%
|
-39.60%
|
213
|
|
63
|
|
|
-4.88%
|
-39.62%
|
213
|
|
64
|
|
|
-6.10%
|
-40.84%
|
114
|
|
65
|
|
|
-6.12%
|
-40.86%
|
2
|
|
66
|
|
|
-7.52%
|
-42.26%
|
43
|
|
67
|
|
|
-17.57%
|
-52.32%
|
93
|
|
68
|
|
|
-19.62%
|
-54.36%
|
248
|
|
69
|
|
|
-20.90%
|
-55.64%
|
267
|
Performance
Number of Trades Issues in 2016 - 2017
---------------------------------------------------------------------------------------------------------------------------
The above shows that more frequent trading does not automatically produce better results. Most individual timing models
that trade frequently do not have ample time to sell and buy back in short time periods end up getting whipsawed. For
example, a model that trades an average of 50 times/year, has an average “signal life” of just 5 trading days (where “signal life”
is the average time any given signal is in effect). This means that the model would have to decide when to buy and when
to sell in just 5 trading days over-and over, all year long without getting whipsawed often. This is damn near impossible
using data from daily bars (1 data point/day), instead of say like hourly bars (for roughly 8 data points/day). MIPS fixed
this in its “Blaster Series” models, released in 1Q’16.
So, you should pick a timing model with a good, long-term verified track record, and follow it. If you can’t simply
do that, start with say 3 models and migrate to the model that does the best over time. If everyone does this,
then it’s a good chance that all may end up following the MIPS models
Paul Distefano, PhD
MIPS Timing Systems, LLC
Houston, TX
281-251-MIPS(6477)
Saturday, March 17 2018
Week before last, the QQQ broke out to the upside and formed a new all-time high. The main
question then, of course, was "where does it go from here" ?
My answer then was:
"I expect the QQQ to climb higher, drop back to "test" this all-time high support level, and then
continue higher in 2018."
The first part of this was completed this week when the QQQ dropped back to test its support level at
around $171 for four straight days (see graph below). As you can see, the current support level held
steadfast at almost exactly $171 on each day.
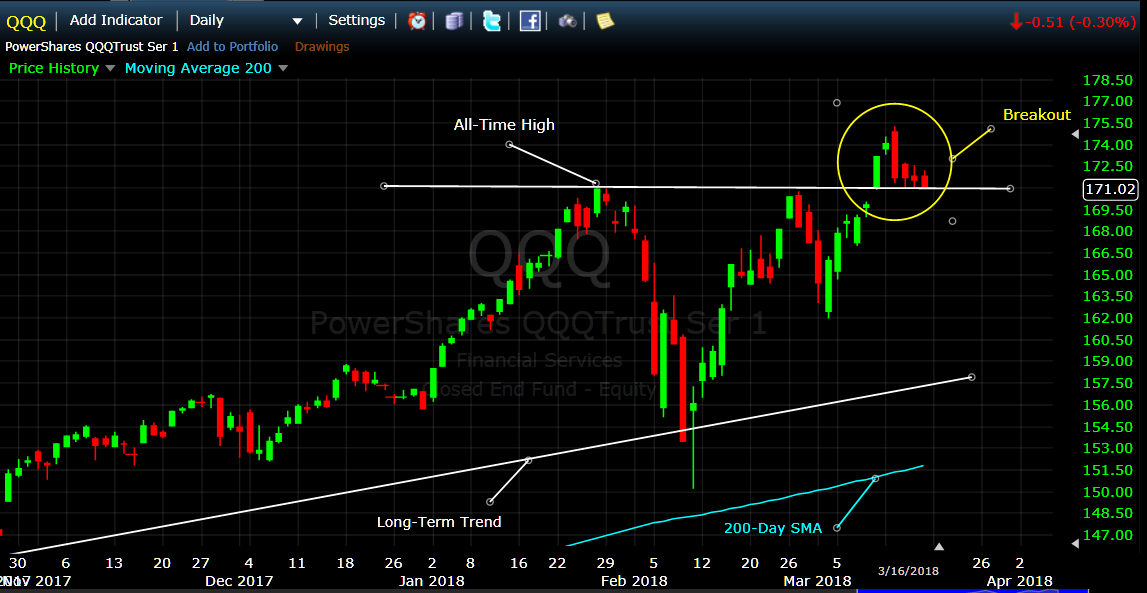
From here, the QQQ could hold its support level and head back up for months; or of course, it could
break its all-time high support level to the downside and head back to test its previous support level at
around $150. My bet would be on the 1st option above, but I am no MIPS.
{BTW - In my opinion, the SPY will follow the same path as the QQQ.}
As far as which position we should be in going forward (long, short, cash), we need to rely on MIPS to
answer that.
Good trading...
Paul Distefano, PhD
CEO / Founder
MIPS Timing Systems, LLC
Houston, TX
281-251-MIPS(6477)
===============================================================
<<< Previous Blog >>>
03/12/2018
MIPS Members:
In our previous blog below, we pointed out that the SPY had broken out of its "triangle" pattern to the
upside, and that the Nasdaq 100 (QQQ) had climbed about 65% of the way back to its all-time high.
Since then, the QQQ has completed a "V-Bottom" pattern and has broken out above its all-time high
(see graph below).
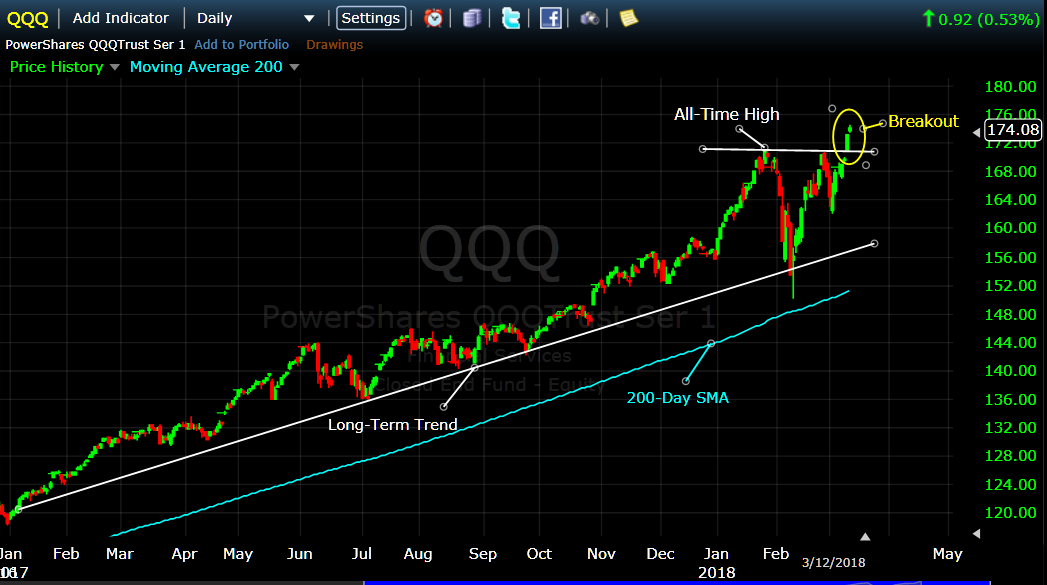
From here, I expect the QQQ to climb higher, drop back to "test" this all-time high support level, and then
continue higher in 2018. Of course, this "climb" will be challenged by real dips, fake drops, volatility,
etc. Top management from many well-respected advisory firms see a strong possibility for this bull market
to thrive for another 2-3 years.
The challenge, of course, is to know when to get out of the market (or go short) WITHOUT chasing every
little fake dip and ending up getting whipsawed (nothing worse). The algorithms built into the Blaster
Series version of MIPS were designed to avoid getting suckered into trading every dip and ending up losing
a lot of your hard earned money. After much research, and through inputs from our MIPS family, we
have not seen nor been told about any other model on the market today that can beat MIPS in that game.
This is a time when we can either have a few more years with 20%+ gains, or a time when we give back
most or all of our gains from the last 8-10 years. Please don't "go it alone". Either use MIPS or find
another good quantitative model that did well in the market crash of 2008, and since then.
Good trading...
Paul Distefano, PhD
CEO / Founder
MIPS Timing Systems, LLC
Houston, TX
281-251-MIPS(6477)
Monday, March 12 2018
In our previous blog below, we pointed out that the SPY had broken out of its "triangle" pattern to the
upside, and that the Nasdaq 100 (QQQ) had climbed about 65% of the way back to its all-time high.
Since then, the QQQ has completed a "V-Bottom" pattern and has broken out above its all-time high
(see graph below).
From here, I expect the QQQ to climb higher, drop back to "test" this all-time high support level, and then
continue higher in 2018. Of course, this "climb" will be challenged by real dips, fake drops, volatility,
etc. Top management from many well-respected advisory firms see a strong possibility for this bull market
to thrive for another 2-3 years.
The challenge, of course, is to know when to get out of the market (or go short) WITHOUT chasing every
little fake dip and ending up getting whipsawed (nothing worse). The algorithms built into the Blaster
Series version of MIPS were designed to avoid getting suckered into trading every dip and ending up losing
a lot of your hard earned money. After much research, and through inputs from our MIPS family, we
have not seen nor been told about any other model on the market today that can beat MIPS in that game.
This is a time when we can either have a few more years with 20%+ gains, or a time when we give back
most or all of our gains from the last 8-10 years. Please don't "go it alone". Either use MIPS or find
another good quantitative model that did well in the market crash of 2008, and since then.
Good trading...
Paul Distefano, PhD
CEO / Founder
MIPS Timing Systems, LLC
Houston, TX
281-251-MIPS(6477)
===========================================
<<< Previous MIPS Blog >>>
MIPS - Was Last Week's Market Move a Breakout ?
MIPS Members:
Of course, everyone wants to know if the most recent "correction" was the beginning of new "bear
market", or just a scare. Let me say that, to my knowledge, there has never been a real "bear market"
without the country being in on near a "recession".
I won't bore you with the details, but by all measures the economy is very strong (growth in the GDP,
more jobs, etc.). So strong, in fact, that investors were initially worried about inflation and rising interest
rates.
I personally believe that this all began after the market that had been climbing for the last year or so
started to soar at a much higher rate and put itself in a position of being highly overbought. Of course, the
fat kats that had ridden the market up did not want to give back a single dime, so they dumped from fear
of inflation and higher interest rates in this booming economy. Then, a few days later, the fat kats who
had driven the market down by about 9% started re-buying, and the little guys joined them with their
"buy on the dips" strategy.
When the market was heading back up quickly to form a near perfect "V-Bottom" pattern, the up-tick was
reversed on a very good jobs report, because investors were sucked in by the crap from the press
claiming that the low unemployment numbers would surely lead to inflation. Then, the crap was negated
by the fact that many new jobs were filled by a small percentage of the massive number of people that had
given up hope for a job and hence were in the "not looking for a job" space. In other words, the new jobs
had not only lowered the jobless rate, but they had INCREASED the "participation level". This means that
many of the new jobs went to some of the millions of people that had given up finding a job and had run
out of gov't unemployment benefits. If this is correct, the labor force is not close to being tight.
As a result of that above, the market seems to have broken out of the current "triangle pattern" seen in
the graph below.
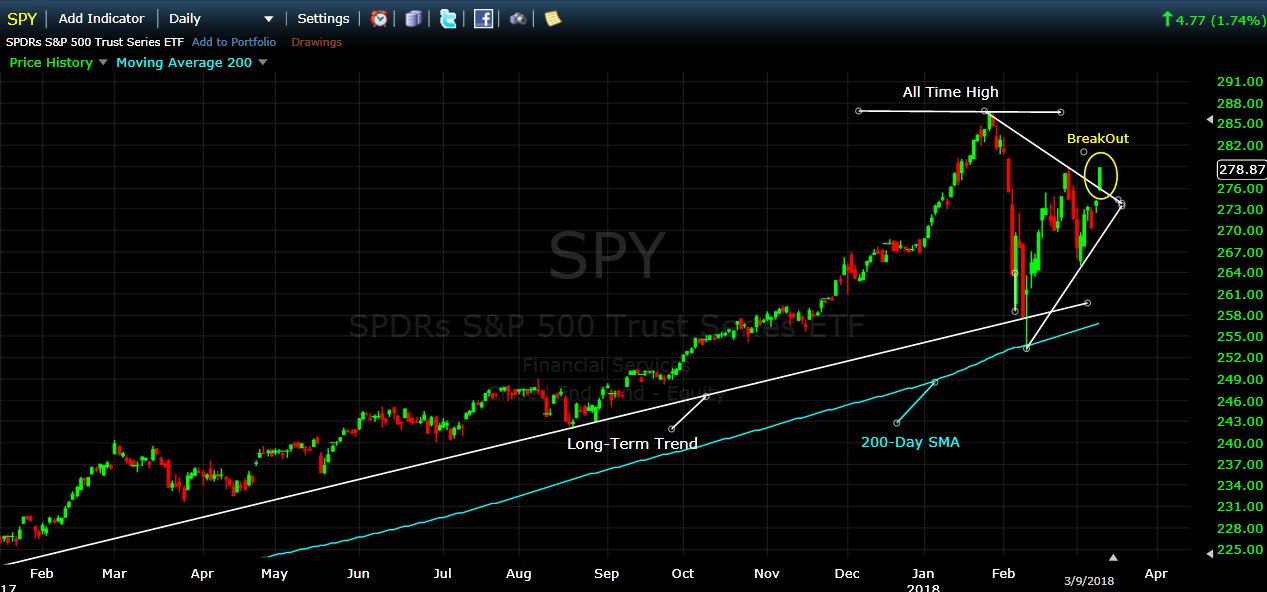
Of course, this does not mean that the market will reach highs in the near future. I think it will, but I am
not MIPS. To be comfortable about when to go in and get out of the market, follow MIPS.
Paul Distefano, PhD
MIPS Timing Systems, LLC
Houston, TX
281-251-MIPS(6477)
Saturday, March 10 2018
Of course, everyone wants to know if the most recent "correction" was the beginning of new "bear
market", or just a scare. Let me say that, to my knowledge, there has never been a real "bear market"
without the country being in on near a "recession".
I won't bore you with the details, but by all measures the economy is very strong (growth in the GDP,
more jobs, etc.). So strong, in fact, that investors were initially worried about inflation and rising interest
rates.
I personally believe that this all began after the market that had been climbing for the last year or so
started to soar at a much higher rate and put itself in a position of being highly overbought. Of course, the
fat kats that had ridden the market up did not want to give back a single dime, so they dumped from fear
of inflation and higher interest rates in this booming economy. Then, a few days later, the fat kats who
had driven the market down by about 9% started re-buying, and the little guys joined them with their
"buy on the dips" strategy.
When the market was heading back up quickly to form a near perfect "V-Bottom" pattern, the up-tick was
reversed on a very good jobs report, because investors were sucked in by the crap from the press
claiming that the low unemployment numbers would surely lead to inflation. Then, the crap was negated
by the fact that many new jobs were filled by a small percentage of the massive number of people that had
given up hope for a job and hence were in the "not looking for a job" space. In other words, the new jobs
had not only lowered the jobless rate, but they had INCREASED the "participation level". This means that
many of the new jobs went to some of the millions of people that had given up finding a job and had run
out of gov't unemployment benefits. If this is correct, the labor force is not close to being tight.
As a result of that above, the market seems to have broken out of the current "triangle pattern" seen in
the graph below.
Of course, this does not mean that the market will reach highs in the near future. I think it will, but I am
not MIPS. To be comfortable about when to go in and get out of the market, follow MIPS.
Paul Distefano, PhD
MIPS Timing Systems, LLC
Houston, TX
281-251-MIPS(6477)
Sunday, February 25 2018
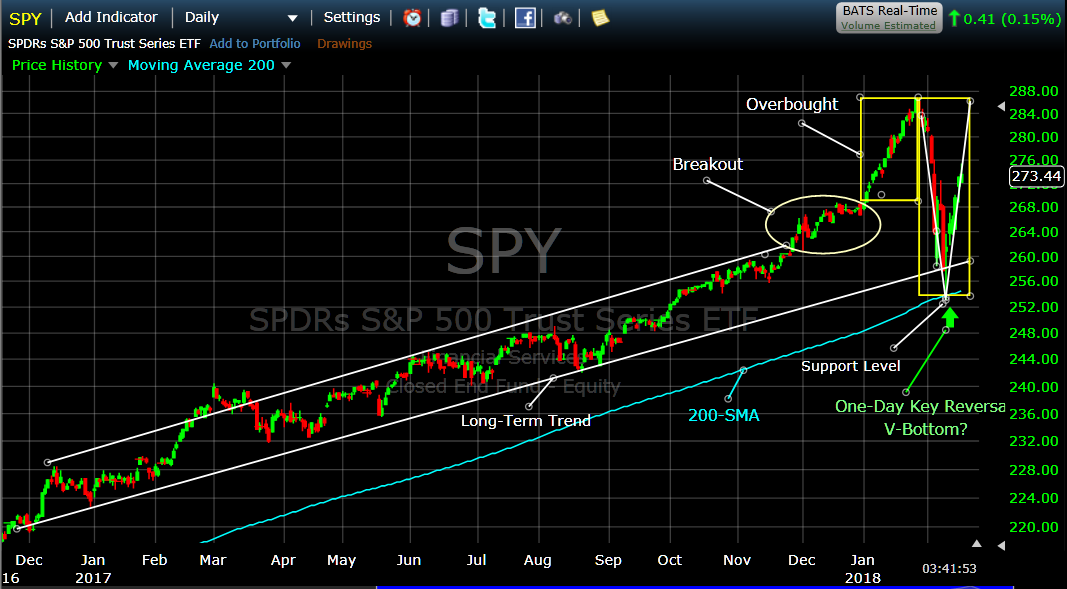
All investors were shocked by how fast the recent drop became an intraday "correction", and most were also shocked by how fast the market recovered. The Nasdaq has recovered about 80% of its drop and the S&P 500 (SPY) has recovered approx 65% (see chart immediately below).
In our last Blog (When is a Market Drop a "Big Drop") http://www.mistiming.com/blogs we mentioned that we thought the main reasons for this correction were rising bond yields, inflation scares, overbought markets, traders taking profits, the "fat kats" heading for the hills, etc. Most likely, this intraday correction was started by trading from very short-term institutional traders (not investors) taking profits after such a recent strong run-up.
At any rate, the SPY experienced a dramatic "one day key reversal" on 02/09/2018, and then it bounced off of its 200-day moving average with great force and formed a very bullish "up-hammer" pattern that day. Since then, the "turn-around" has recovered approximately 2/3rds (66%) of the drop.
So, where will the market go from here ???
We all know that none of us can answer that question, so let's look at what I think are the two most probable happenings.
1) The SPY could complete the V-Bottom and continue up from there. We believe that if this happens, the market will retain its bullish conditions and will continue up for the next several months. This, of course, would result from rising corporate profits, strong economy, strong job market, etc. Note: If the SPY does break up after completing its V-Bottom, it could come back temporarily to test its breakout level.
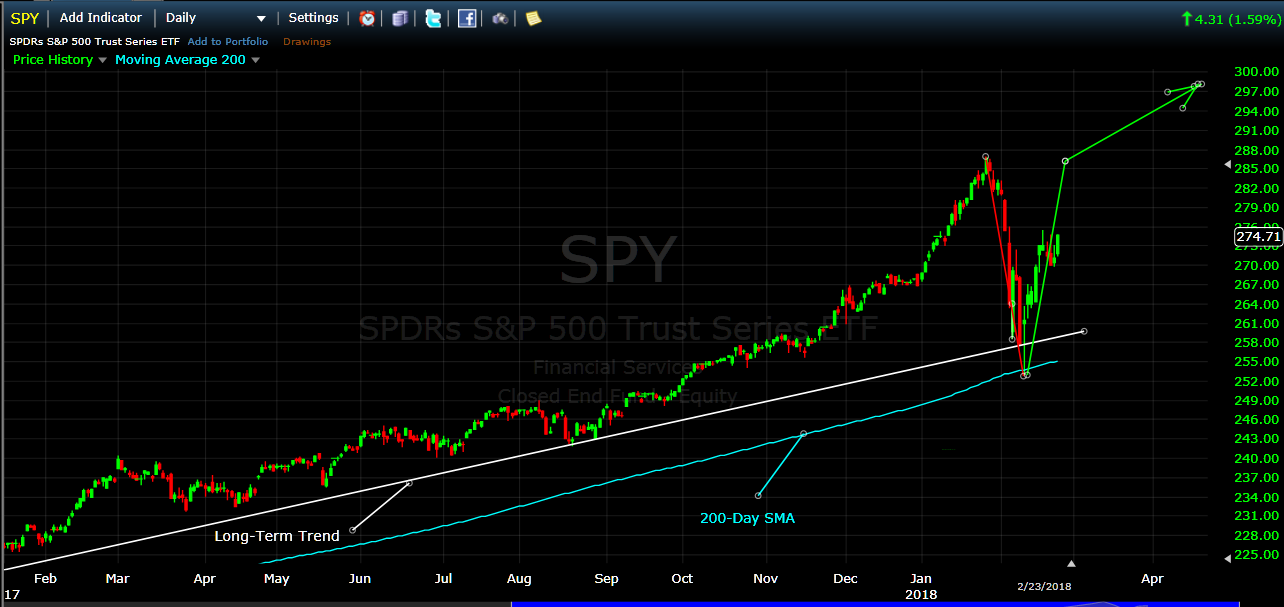
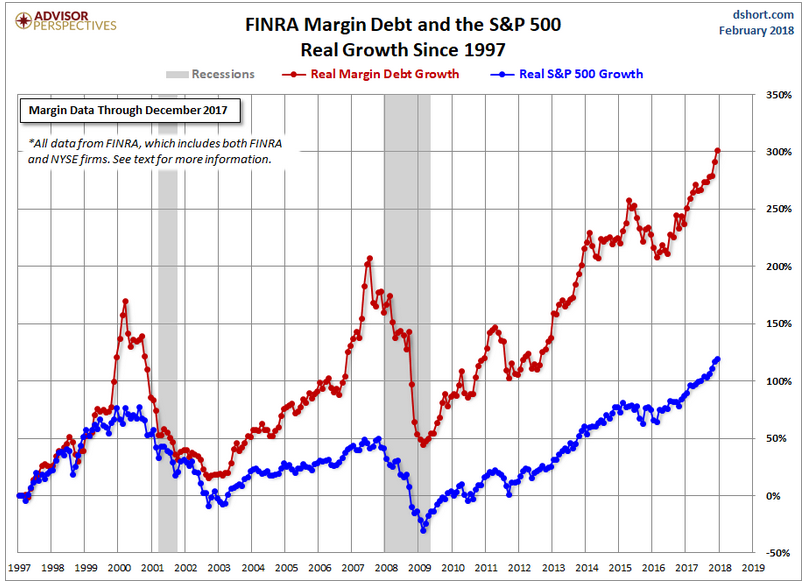
2) The SPY could go back to the all-time high where the correction started, and fall back into a full market crash. This would constitute what is called a "Double Top"; which is a proven, highly bearish pattern (1st graph below). If this actually happens in this market at this time, I believe that the major reasons would be the highly overbought market and the outrageously high margin debt at this time. In case you are not aware, the margin debt is basically the amount of money investors have "borrowed" to buy equities. When the margin debt is high, a strong pullback will force investors and traders to sell in order to pay down their debt. And, at this time, the market it is right up there with the highest levels in stock market history, and all market crashes have occurred at margin debt levels lower than it is now (see 2nd graph below). PS: This does not mean that high margin debt will indeed tank the market now, but it will be a strong catalyst somewhere along the way.

..
.
.
MARGIN DEBT
SO, WHAT DO WE DO NOW ???
If you are a relatively young person (say like under 35), you can make mistakes with your investment money now and still have a chance (at least a remote chance) to "make it back", so do whatever you want now. But, if you are over 40, or less than 15-20 years from retirement, you cannot make big mistakes now because you most likely do not have time to make it back even if you do the right things after your losses. And remember, the stock market experiences market crashes (drops of 40-65%) more often than once every decade (like in 1987, 2000, 2008 and ???). SO, TO GET THROUGH THIS ROUGH TIME, PLEASE USE MIPS OR FIND ANOTHER GOOD MODEL (OR MODELS) TO HELP YOU DECIDE WHEN TO BE INVESTED LONG OR SHORT OR BE IN CASH. And, if you do not know what to do, you can call me and I will tell you about MIPS and any other model that you may be considering.
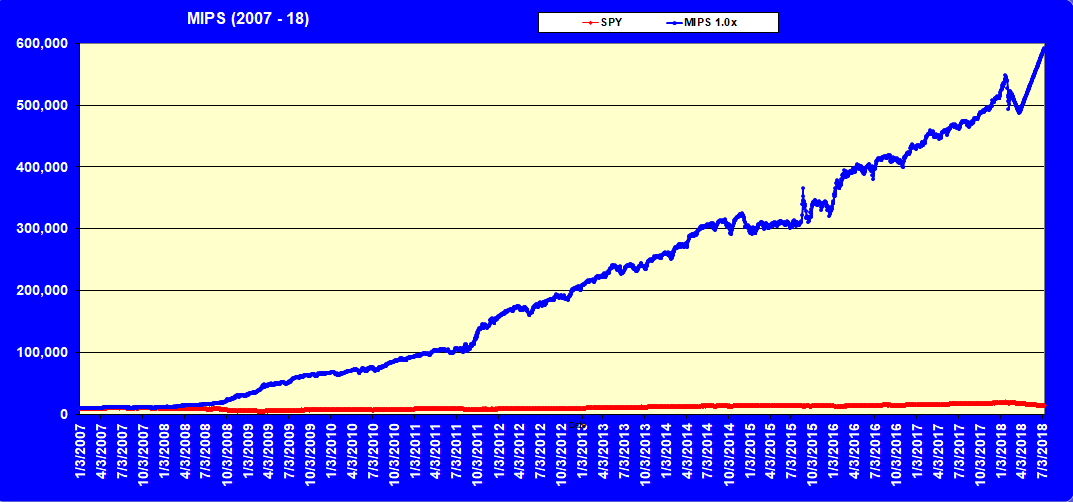
MIPS PERFORMANCE IN DOWN MARKETS, including now !!!
To help us understand what MIPS is most likely to do if the market drops 25% straight down over the next few months, we tested MIPS with many of its most reliable "predictive" algorithms to show us what the most likely outcome would be (see graph below). Results: MIPS would head down about 10% from where it is now, then climb back over 20%.
.
.
MIPS3's actual performance in 2008 (verified by TimerTrac.com)
MIPS3 +140%
SPY - 60%
PLEASE DO NOT TAKE A CHANCE NOW BY YOURSELF !!!
Best Wishes...
Paul Distefano, PhD
CEO / Founder
MIPS Timing Systems, LLC
281-251-MIPS(6477)
Saturday, February 17 2018
In the last few weeks, we have seen the market drop what appears to be rather dramatically; e.g., over 10% in one week (see graphs below). There are plenty of reasons being shared in the media for this, such as raising bond yields, inflation scares, overbought markets, traders taking profits, the "fat kats" heading for the hills, etc. Most likely, this mini-crash was started by trading from very short-term institutional traders (not investors) taking profits after such a recent strong run-up. This behavior has almost dominated the news, and has resulted in what could be called "panic" behavior in the markets.
One way to put this in perspective is to look at the "long-term" view of the SPY compared to the "drop" discussed above (kind of like looking at the extent of a forest fire from an airplane). As you will see in the graph below, the SPY dropped about 10% in the last several weeks; but over the last 9 years, it has dropped over 15% several times, and droped between 6-8% many times without much fanfare. What makes this drop different is that it happened quickly (and with two daily drops in the Dow in excess of 1000 points each !!!).
So, as you can see below with all things considered, the "drop" does not seem to be as bad as it has been made out to be. We are very proud that the MIPS models were not sucked into issuing a Cash or Short signal.
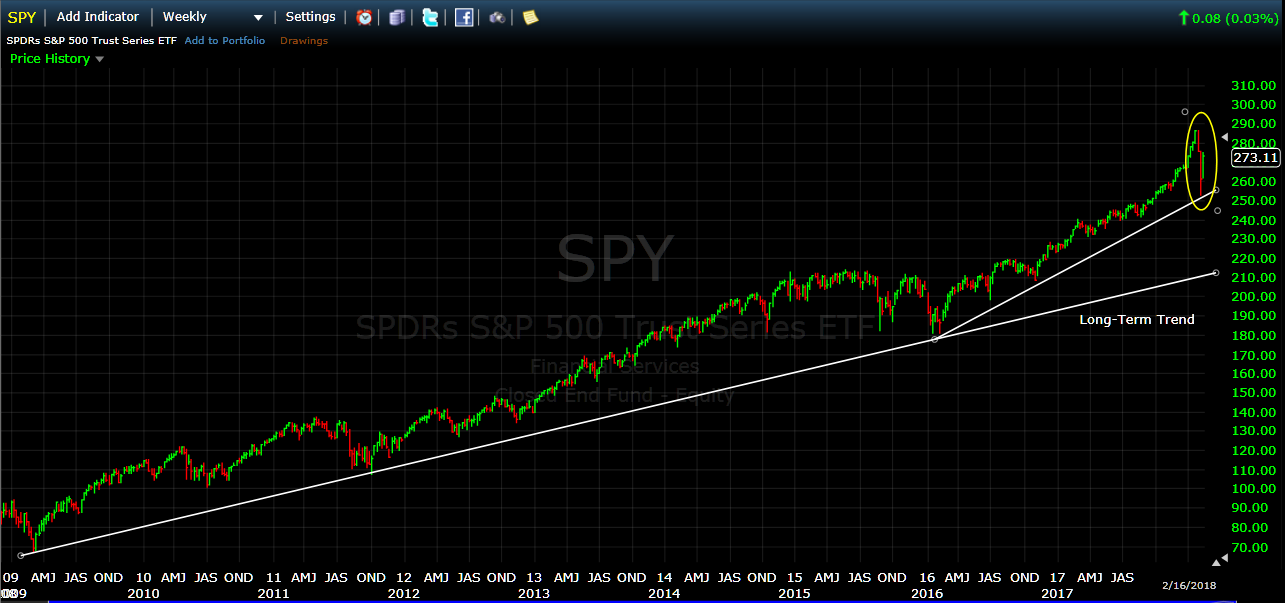
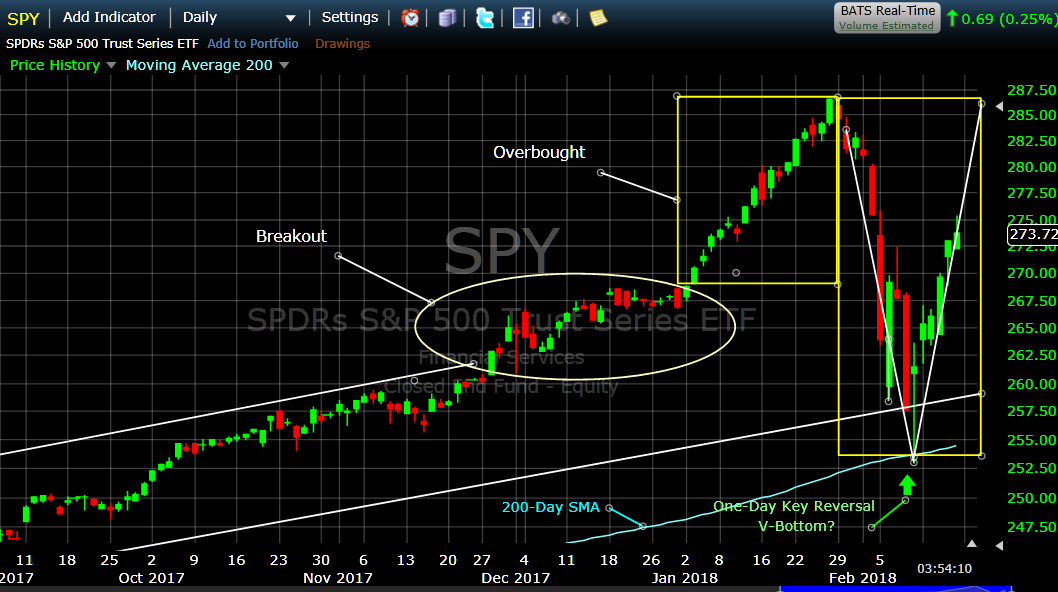
In fact, we now believe that the recent "drop" was simply what is called a "V-Bottom" pattern (see below).
A V-Bottom pattern is one where:
1) the market falls quickly in an almost straight line,
2) it almost always ends the drop with a dramatical "one day key reversal", and
3) it goes up in a path that is very similar to the path down.
This V-Bottom in Greater Detail
I have always believed that V-Patterns are formed from the trading by very short-term traders with an amazing amount of money that trade the cash in the accounts of the biggest of the big "fat kats" (Morgan Stanley, Goldman Sachs, Pimco, etc). They almost immediately dump when they have big gains to protect and when they even "smell" a big drop coming, with little or NO regard for what they think may have perpetrated the drop. Believe me, when these guys trade the volume soars and the prices move accordingly. And, I have always believed that the reason the recovery path looks almost just like the drop path is because, after the smoke clears, these traders are buying back what they sold near the prices where they sold (see more detailed graph below).
Also, please notice that on 02/09/2018, the SPY bounced off of its 200-day moving average with great force and formed the very bullish "Up- Hammer" pattern that day.
BTW - The reason that the MIPS models DID NOT issue a Cash or Short Signal during this drop period is because our models have "Relativity" algorithms built in (as opposed to just absolute algorithms). This means that the MIPS models put more weight on % changes relative to past performance rather than just the change itself.
The net result of this would be: If the market has gone up substantially in the last 30-90 days, MIPS may ignore a 6-8% drop with no signal change; whereas if the market had been relatively flat or had only had smallish gains in this time period, the MIPS models most likely would have signaled a change even on a 4-6% drop.
Let's wait for MIPS to tell us what to do next...
- and remember, no new signal on any give day is in effect a signal to stay put.
Good Trading...
Paul Distefano, PhD
CEO / Founder
MIPS Timing Systems, LLC
Houston, TX
281-251-MIPS(6477)
support@mipstiming.com
Thursday, February 08 2018
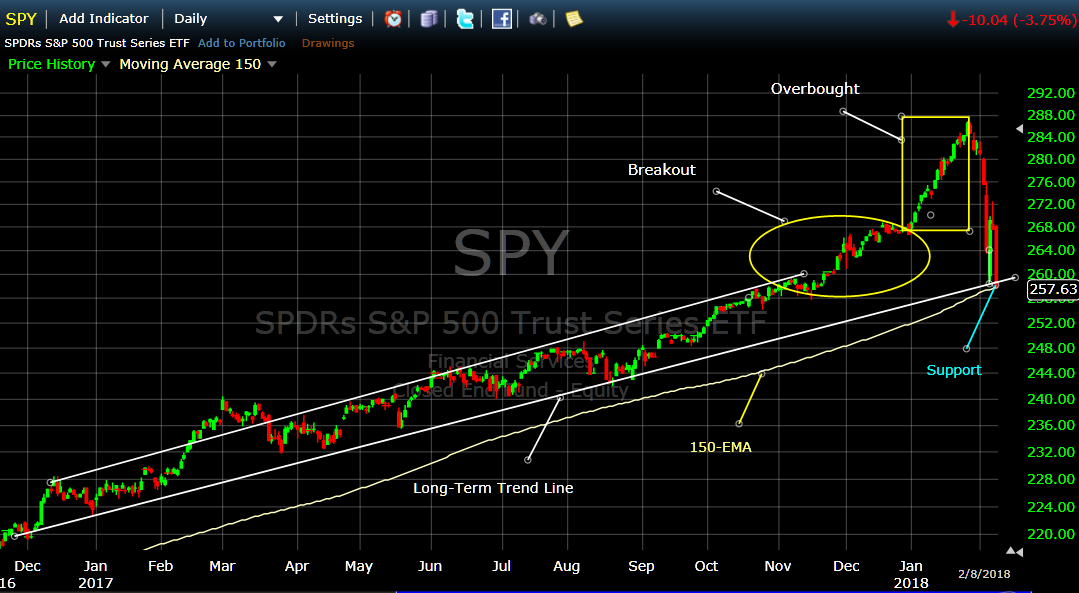
Today was another terrible day for the stock market. The big drop today drove all of the major indices into "Correction" territory (between a -10% and -20% drop). For most of us, it's pretty tough to experience a drop like this over just a few days.
Without trying to figure out how we got into this mess (rising interest rates, inflation worries, overbought markets, etc), let's try to figure out where the market is going from here. Tomorrow's market performance is very important and that is why I designate tomorrow as a "Critical" day (see graph below).
As you can see, the drop in the market since the end of Jan 2018 has been steep and vicious; as it resulted in about a -10% loss for all of the major indices. Thankfully, today's drop in the SPY shown below held just above its "support" level of $257.6/share on both the Long-Term Trend Line and the 150-day EMA. That is why tomorrow's market performance is critical. If this "support" level does not hold, this bull market could be in trouble (at least, short-term). For example, the only thing left to stop this drop now is the 200-day EMA; and I surely do not want to go there.
Of course, these commonly used "indicators" are a very small part of the MIPS models. But, they are interesting to watch, mainly because many other quantitative models rely 100% on several of them (NOT recommened).
Even though MIPS seems to be on the verge of triggering a Cash or Short signal, anything can happen.
So, stay tuned to MIPS...
Paul Distefano, PhD
MIPS Timing Systems, LLC
Houston, TX
281-251-MIPS(6477)
==================================================================.
<<< Yesterday's MIPS Blog >>>
Wow! What a nerve-racking market we have had in the last few trading days. As of today's date, the S&P 500 is close to "giving back" all of the gains it made in 2018.
Seems like everyone wants to know, "Is this a relatively small "dip" or a big "drop", as in an official correction? Or even, is this the beginning of a full-fledged market crash.
I am very comfortable that MIPS would protect us from the "sting" of a crash (as in 2008, shown below), and I don't believe this is even in the cards at this time. The only "indicator" that I know that works 100% of the time is that market crashes DO NOT happen during strong economies with rising corporate profits. We have both at this time, and expect them to continue.
If I am correct above, this leaves us with either a smallish dip or a correction. If we are in for a smallish dip, this has already happened (-9%) and the market should head back up for a while (for about as long as our economy stays strong). But, we do not want the economy to get overheated, because this will cause the Fed to stick their nose in and screw things up by overreacting (like they almost always do).
I think we all know (or believe) that the two culprits that have caused the fast dip in market prices so far have been the very highly "overbought" market and the Fed's plans for interest rate hikes.
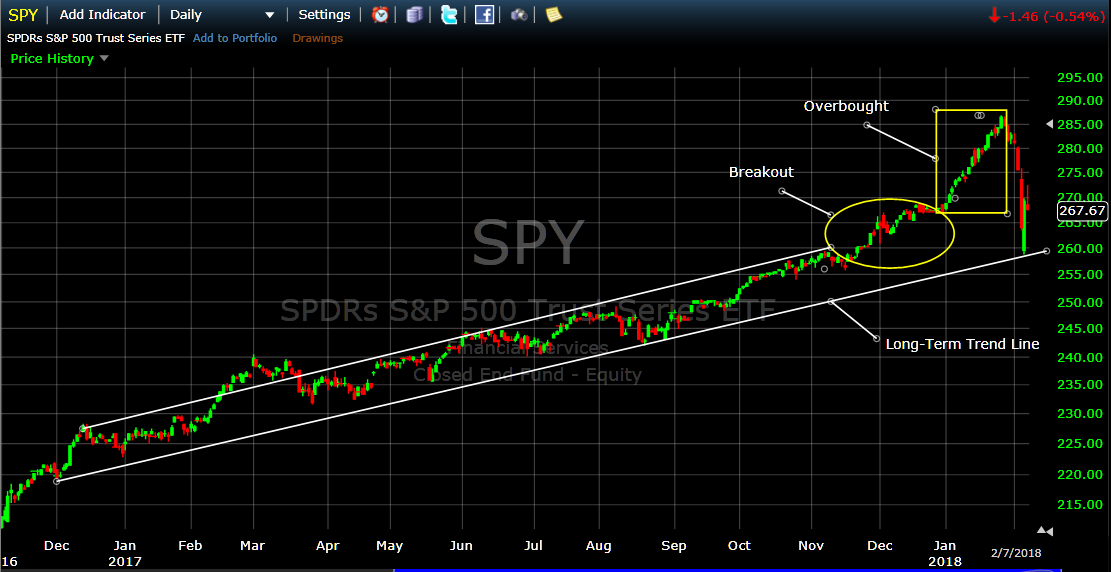
Let's look at the dip in the market a little closer and see how bad it actually has been before we dwell on the reasons for the drop and how we are going to protect our portfolios now (see graph immediately below).
1) From Dec'16 to Nov'17 the SPY moved in a "near perfect" long-term up-channel.
2) In mid-Nov'17, the SPY picked up steam and moved above the upper line in the channel.
3) Between Jan 1, 2018 and Jan 26, 2018 the SPY took off like it was launched like a rocket.
4) Most investors knew this would come to an end, but not when.
5) Almost all pure reversion-to-the-mean models and algorithms were warning to get out; but
trend following models (like MIPS) usually would not trigger a cash or short signal as long
as the SPY remained above the long-term trendline (along with what the other indicators
and algorithms in the model were advising).
As you know (and can see below), the SPY dipped on Jan 29, 2018 and then dropped all the way
down to the long-term trendline on Feb 5th, and bounced back up some on Feb 6th. The SPY held
above the trendline again today (Feb 7th). Most likely, the SPY will again "test" the long-term
trendline; and, of course, it is of utmost importance for the SPY to remain above the trend-line.
Otherwise, look for trouble.
Note: The graph below is using Daily Bars.
So, as we can see, the market could go either way at this time and MIPS members want to know if MIPS can react fast enough to protect us from losing big money (or even help us to make money in a down market).
This leads to the question, "Can MIPS respond quickly to a drop of 8-9%?"
The simple answer is that MIPS absolutely, positively CAN (and does) react to drops of -9% or less,
but it depends on the market circumstances at that time.
- MIPS can react to a 4-5% drop if the market has been relatively flat or growing very slowly, but
- MIPS will not react quickly to a 8-9% drop if the market has been growing fast and strong (as now)
- this decision is made by "relativity" algorithms that are built into the MIPS computer code
- and, these algorithms greatly reduce the probability of getting whipsawed.
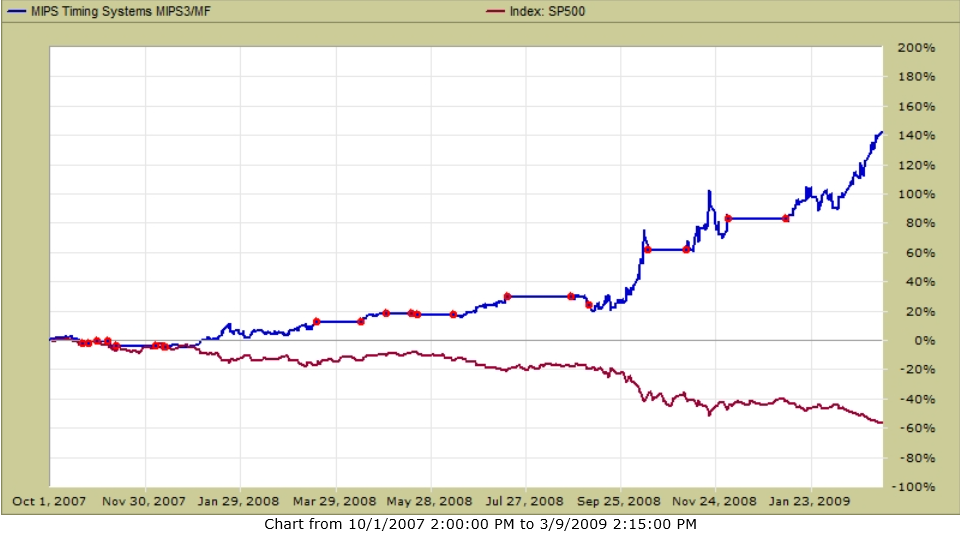
To show this, look at the actual MIPS3 signals below in the stock market Crash of 2008
- this "Crash" started at the end of Oct 2007 and recovered in mid-March 2009.
In the graph below from TimerTrac.com, you can see that:
- MIPS issued a critical "short signal" in mid-Dec 2007
- and, this was after about a -5% drop
- during this time, the SPY dropped -60% and MIPS3 was up +140% (verified by TimerTrac.com).
PS - this performance resulted from trading the SPY Long/Short/Cash with no leverage.
Note: Red dots designate MIPS3 trade Signals
Hope this helps !!!
Paul Distefano
-- Contact Info ---
Paul Distefano, PhD
Founder/CEO
MIPS Timing Systems, LLC
Houston, TX
281-251-MIPS(6477)

www.mipstiming.com
support@mipstiming.com
Wednesday, February 07 2018
Wow! What a nerve-racking market we have had in the last few trading days. As of today's date, the S&P 500 is close to "giving back" all of the gains it made in 2018.
Seems like everyone wants to know "Is this a relatively small "dip" or a big "drop", as in an official correction? Or even, is this the beginning of a full fledge market crash.
I am very comfortable that MIPS would protect us form the "sting" of a crash (as in 2008, shown below), and I don't believe this is even in the cards at this time. The only "indicator" that I know that works 100% of the time is that market crashes DO NOT happen during strong economies with rising corporate profits. And, we have both at this time.
If I am correct above, this leaves us with either a smallish dip or a correction. If we are in for a smallish dip, this has already happened (-9%) and the market should head back up for a while (for about as long as our economy stays strong). But, we do not want the economy to get over-heated, because this will cause the Fed to stick their nose in and screw thing up by overreacting (like they almost always do).
I think we all know (or believe) that the two culprits that have caused the fast dip in market prices so far has been the very highly "overbought" market and the Fed's plans for interest rate hikes.
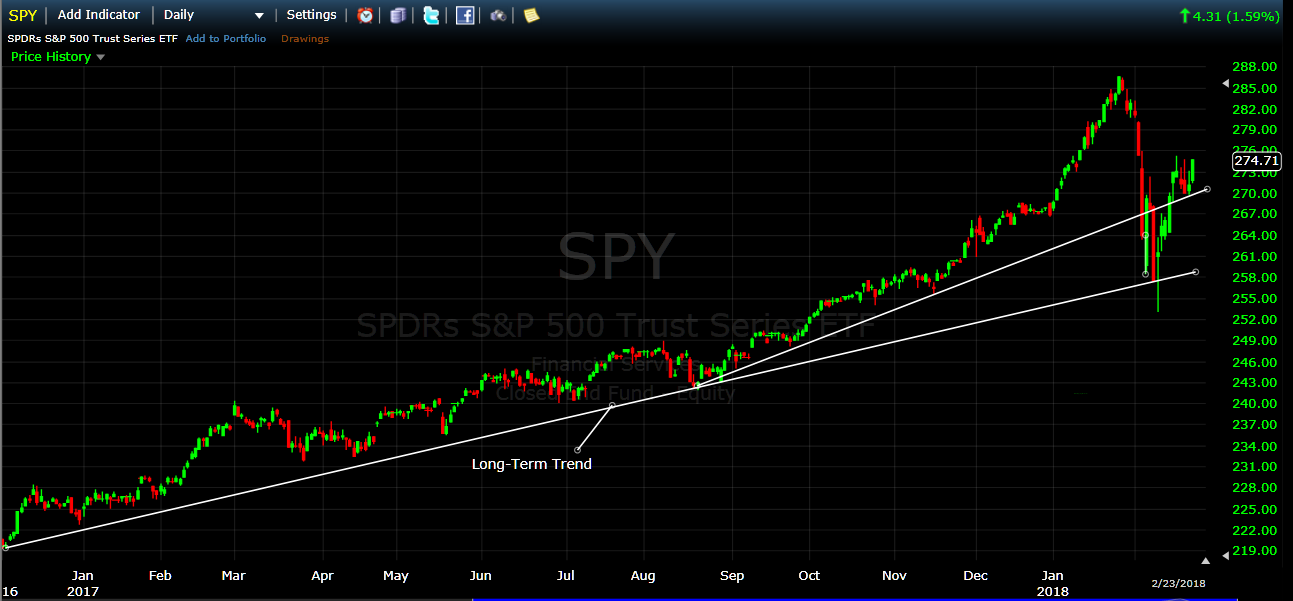
Let's look at the dip in the market a little closer and see how bad it actually has been before we discuss the reasons for the drop and how we are going to protect our portfolios now (see graph immediately below).
1) From Dec'16 to Nov'17 the SPY moved in a "near perfect" long-term trend.
2) In mid-Nov'17, the SPY picked up steam and moved above the upper line in the channel.
3) Between Jan 1, 2018 and Jan 26, 2018 the SPY took off like it was launched as a rocket.
4) Most investors knew this would come to an end, but not when.
5) Almost all pure reversion-to-the-mean models and algorithms were warning to get out, but
trend following models (like MIPS) usually would not trigger a cash or short signal as long
as the SPY remained above the long-term trendline (along with what the other indicators
and algorithms in the model were advising)
As you know (and can see below), the SPY dipped on Jan 29, 2018 and then dropped all he way
down to the long-term trendline on Feb 5th, and bounced back up some on Feb 6th. The SPY held
above the trendline again today (Feb 7th). Most likely, the SPY will again "test" the long-term
trendline; and, of course, it is of utmost importance for the SPY to remain above the trend-line.
Otherwise, look out for trouble.
Note: The graph below is using Monthly Bars.

So, as we can see, the market could go either way at this time and MIPS members want to know if MIPS can react fast enough to protect us from losing money (or even help us to make money in a down market)
This leads to the question "Can MIPS respond quickly to a drop of 8-9%?"
The simple answer is that MIPS absolutely, positively CAN (and does) react to drops of -9% or less,
but it depends on the market circumstances at that time.
- e.g., MIPS can react to a 4-5% drop if the market has been relatively flat or growing very slowly, but
- MIPS will not react too quickly to a 8-9% drop if the market has been growing fast and substantially
(as in the last several months)
- this decision is made by "relatively" algorithms that are built into the MIPS computer code
- and, these algorithms GREATLY reduce the probability of getting WHIPSAWED
To show this, look at the actual MIPS3 signals below in the stock market CRASH of 2008
- this CRASH started at the end of Oct 2007 and recovered in mid-March 2009
In the graph below from TimerTrac.com, you can see that:
- MIPS issued a critical "short signal" in mid-Dec 2007
- and, this was after about a -5% drop
- during this time, the SPY dropped -60% and MIPS3 was up +140% (verified by TimerTrac.com)
PS - this performance resulted from trading the SPY Long/Short/Cash with no leverage
Note: Red dots designate MIPS3 trade Signals

Hope this helps !!!
Paul Distefano
-- Contact Info ---
Paul Distefano, PhD
Founder/CEO
MIPS Timing Systems, LLC
Houston, TX
281-251-MIPS(6477)

www.mipstiming.com
support@mipstiming.com
|


